

Role of type 1 IFNs in antiglioma immunosurveillance--using mouse studies to guide examination of novel prognostic markers in humans
- PMID: 20472682
- PMCID: PMC2896455
- DOI: 10.1158/1078-0432.CCR-10-0644
Role of type 1 IFNs in antiglioma immunosurveillance--using mouse studies to guide examination of novel prognostic markers in humans
Abstract
Purpose: We hypothesized that the type 1 IFNs would play a pivotal role in antiglioma immunosurveillance through promotion of type 1 adaptive immunity and suppression of immunoregulatory cells.
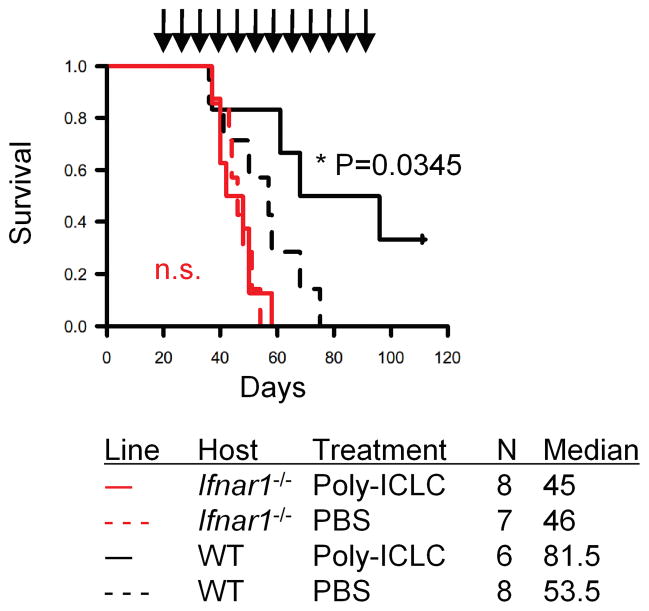
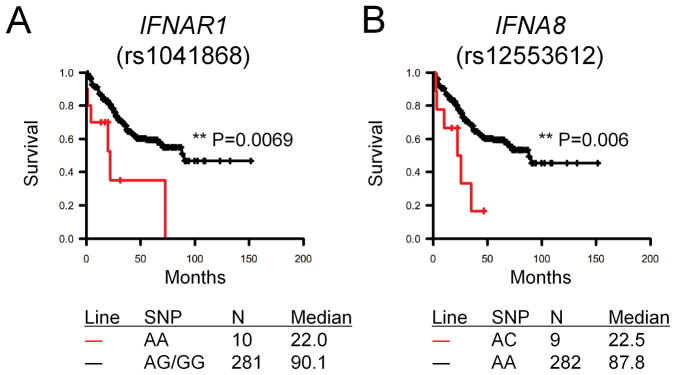
Experimental design: We induced de novo gliomas in Ifnar1(-/-) (deficient for type 1 IFN receptors) or wild-type mice by intracerebroventricuar transfection of NRas and a short hairpin RNA against P53 using the Sleeping Beauty transposon system. We analyzed the survival of 587 glioma patients for single nucleotide polymorphisms (SNP) in type 1 IFN-related genes.
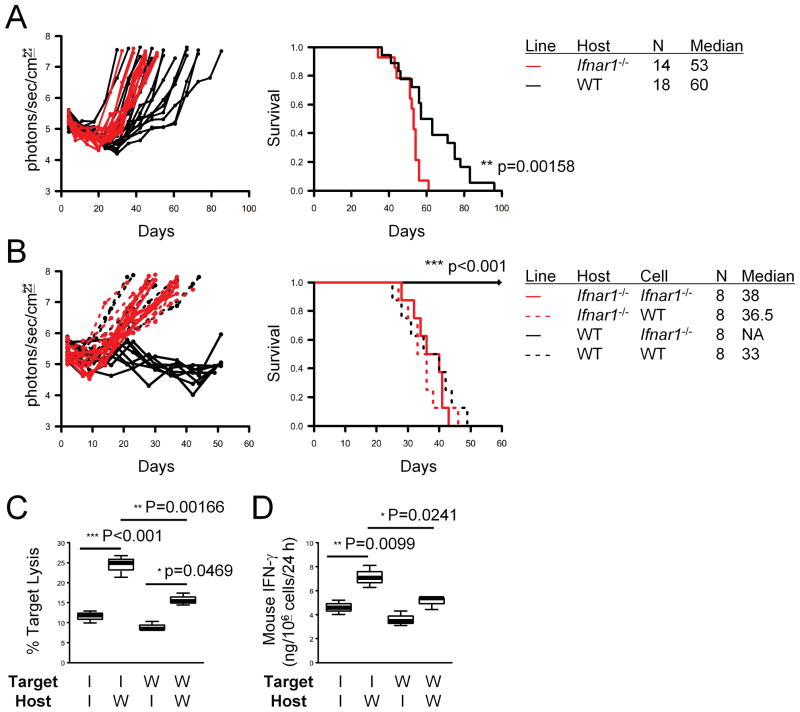
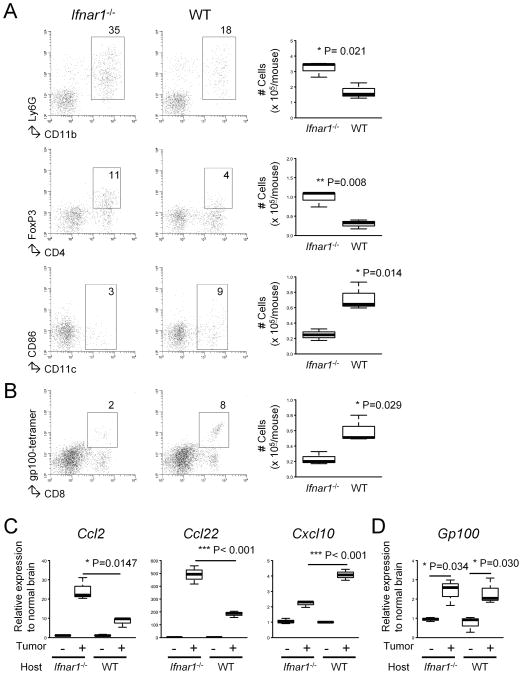
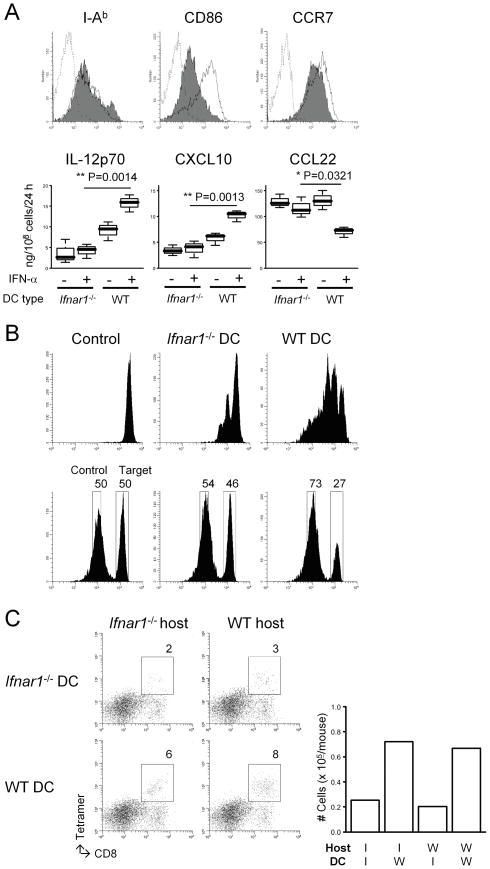
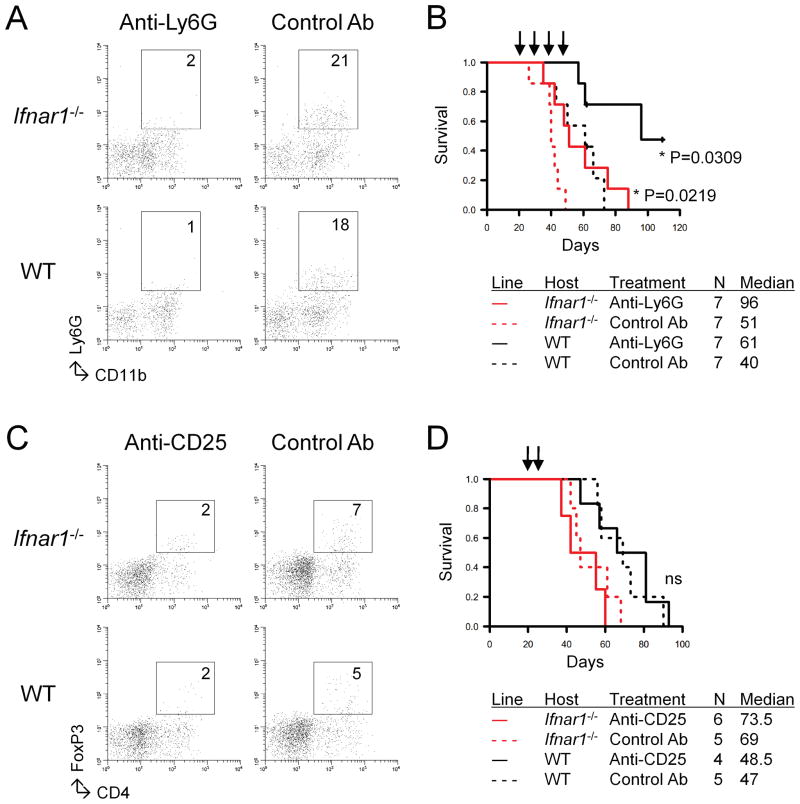
Results: Ifnar1(-/-) mice exhibited accelerated tumor growth and death. Analyses of brain tumor-infiltrating lymphocytes in Ifnar1(-/-) mice revealed an increase of cells positive for CD11b(+)Ly6G(+) and CD4(+)FoxP3(+), which represent myeloid-derived suppressor cells and regulatory T cells, respectively, but a decrease of CD8(+) cytotoxic T lymphocytes (CTLs) compared with wild-type mice. Ifnar1(-/-) mouse-derived glioma tissues exhibited a decrease in mRNA for the CTL-attracting chemokine Cxcl10, but an increase of Ccl2 and Ccl22, both of which are known to attract immunoregulatory cell populations. Dendritic cells generated from the bone marrow of Ifnar1(-/-) mice failed to function as effective antigen-presenting cells. Moreover, depletion of Ly6G(+) cells prolonged the survival of mice with developing gliomas. Human epidemiologic studies revealed that SNPs in IFNAR1 and IFNA8 are associated with significantly altered overall survival of patients with WHO grade 2 to 3 gliomas.
Conclusions: The novel Sleeping Beauty-induced murine glioma model led us to discover a pivotal role for the type 1 IFN pathway in antiglioma immunosurveillance and relevant human SNPs that may represent novel prognostic markers.
Figures
Similar articles
-
Type I interferon suppresses tumor growth through activating the STAT3-granzyme B pathway in tumor-infiltrating cytotoxic T lymphocytes.J Immunother Cancer. 2019 Jun 22;7(1):157. doi: 10.1186/s40425-019-0635-8. J Immunother Cancer. 2019. PMID: 31228946 Free PMC article.
-
Dendritic Cell-Based Vaccines that Utilize Myeloid Rather than Plasmacytoid Cells Offer a Superior Survival Advantage in Malignant Glioma.J Immunol. 2015 Jul 1;195(1):367-76. doi: 10.4049/jimmunol.1401607. Epub 2015 May 29. J Immunol. 2015. PMID: 26026061 Free PMC article.
-
STING contributes to antiglioma immunity via triggering type I IFN signals in the tumor microenvironment.Cancer Immunol Res. 2014 Dec;2(12):1199-208. doi: 10.1158/2326-6066.CIR-14-0099. Epub 2014 Oct 9. Cancer Immunol Res. 2014. PMID: 25300859 Free PMC article.
-
Basic concepts in glioma immunology.Adv Exp Med Biol. 2012;746:42-52. doi: 10.1007/978-1-4614-3146-6_4. Adv Exp Med Biol. 2012. PMID: 22639158 Review.
-
Immune microenvironment of gliomas.Lab Invest. 2017 May;97(5):498-518. doi: 10.1038/labinvest.2017.19. Epub 2017 Mar 13. Lab Invest. 2017. PMID: 28287634 Review.
Cited by
-
Radiotherapy combined with anti-CEACAM1 immunotherapy to induce survival advantage in glioma.Discov Oncol. 2023 Mar 16;14(1):32. doi: 10.1007/s12672-023-00638-x. Discov Oncol. 2023. PMID: 36928507 Free PMC article.
-
COX-2 blockade suppresses gliomagenesis by inhibiting myeloid-derived suppressor cells.Cancer Res. 2011 Apr 1;71(7):2664-74. doi: 10.1158/0008-5472.CAN-10-3055. Epub 2011 Feb 15. Cancer Res. 2011. PMID: 21324923 Free PMC article.
-
Integration of epidemiology, immunobiology, and translational research for brain tumors.Ann N Y Acad Sci. 2013 May;1284(1):17-23. doi: 10.1111/nyas.12115. Ann N Y Acad Sci. 2013. PMID: 23651189 Free PMC article.
-
Premetastatic soil and prevention of breast cancer brain metastasis.Neuro Oncol. 2013 Jul;15(7):891-903. doi: 10.1093/neuonc/not031. Epub 2013 Apr 17. Neuro Oncol. 2013. PMID: 23595625 Free PMC article.
-
Anti-human-cytomegalovirus immunoglobulin G levels in glioma risk and prognosis.Cancer Med. 2013 Feb;2(1):57-62. doi: 10.1002/cam4.44. Epub 2013 Feb 3. Cancer Med. 2013. PMID: 24133628 Free PMC article.
References
-
- Dunn GP, Old LJ, Schreiber RD. The three Es of cancer immunoediting. Annu Rev Immunol. 2004;22:329–60. - PubMed
-
- Dunn GP, Koebel CM, Schreiber RD. Interferons, immunity and cancer immunoediting. Nat Rev Immunol. 2006;6:836–48. - PubMed
-
- Pharoah PD, Dunning AM, Ponder BA, Easton DF. Association studies for finding cancer-susceptibility genetic variants. Nat Rev Cancer. 2004;4:850–60. - PubMed
Publication types
MeSH terms
Substances
Grants and funding
- R21 NS055738/NS/NINDS NIH HHS/United States
- P01 CA132714-028081/CA/NCI NIH HHS/United States
- K07CA131505/CA/NCI NIH HHS/United States
- R01 CA119215-05/CA/NCI NIH HHS/United States
- P01 NS040923/NS/NINDS NIH HHS/United States
- 2P01NS40923/NS/NINDS NIH HHS/United States
- K07 CA131505-02/CA/NCI NIH HHS/United States
- F31 NS067937-02/NS/NINDS NIH HHS/United States
- R01 CA070917/CA/NCI NIH HHS/United States
- R01 CA119215/CA/NCI NIH HHS/United States
- P01 CA132714/CA/NCI NIH HHS/United States
- 1R01CA119215/CA/NCI NIH HHS/United States
- R01 NS055140/NS/NINDS NIH HHS/United States
- R01 CA160782/CA/NCI NIH HHS/United States
- 1P01CA132714/CA/NCI NIH HHS/United States
- R21 NS055738-02/NS/NINDS NIH HHS/United States
- K07 CA131505-03/CA/NCI NIH HHS/United States
- 1R01CA070917/CA/NCI NIH HHS/United States
- 1R01NS055140/NS/NINDS NIH HHS/United States
- K07 CA131505/CA/NCI NIH HHS/United States
- P01 NS040923-080005/NS/NINDS NIH HHS/United States
- F31 NS067937/NS/NINDS NIH HHS/United States
- R01 NS055140-03/NS/NINDS NIH HHS/United States
- WT_/Wellcome Trust/United Kingdom
- 1R21NS055738/NS/NINDS NIH HHS/United States
- R01 CA070917-09/CA/NCI NIH HHS/United States
- 1F31NS067937-01/NS/NINDS NIH HHS/United States
LinkOut - more resources
Full Text Sources
Medical
Research Materials
Miscellaneous
