. 2010 May 6;6(5):e1000882.
doi: 10.1371/journal.ppat.1000882.

Galectin-9/TIM-3 interaction regulates virus-specific primary and memory CD8 T cell response

Affiliations

Galectin-9/TIM-3 interaction regulates virus-specific primary and memory CD8 T cell response

Sharvan Sehrawat et al. PLoS Pathog. .

Abstract

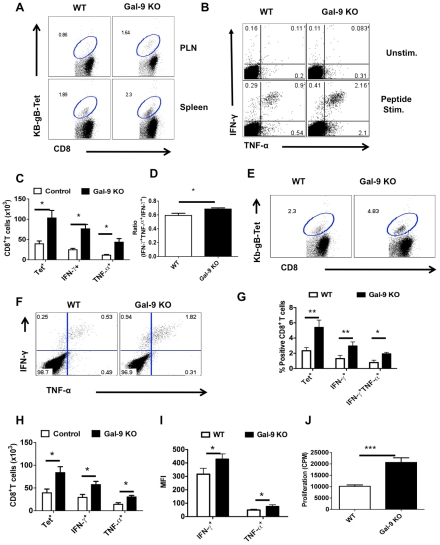
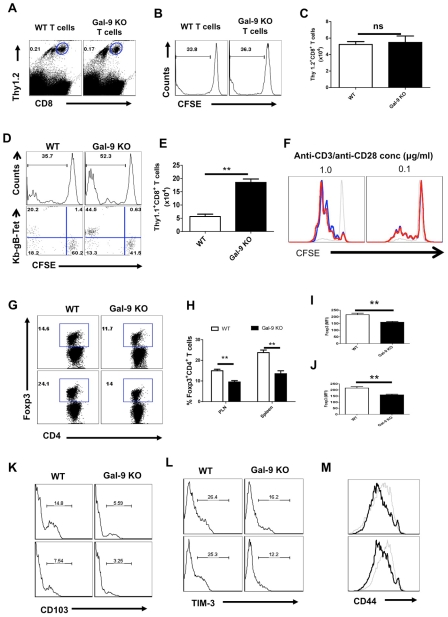
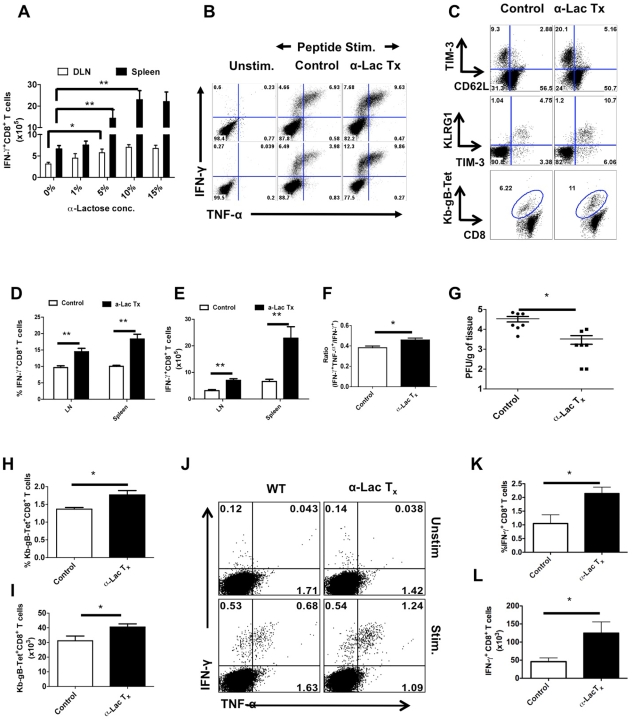
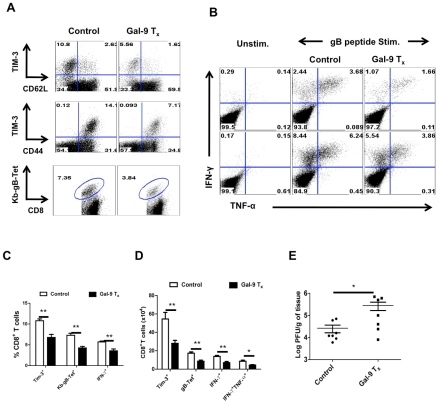
In this communication, we demonstrate that galectin (Gal)-9 acts to constrain CD8(+) T cell immunity to Herpes Simplex Virus (HSV) infection. In support of this, we show that animals unable to produce Gal-9, because of gene knockout, develop acute and memory responses to HSV that are of greater magnitude and better quality than those that occur in normal infected animals. Interestingly, infusion of normal infected mice with alpha-lactose, the sugar that binds to the carbohydrate-binding domain of Gal-9 limiting its engagement of T cell immunoglobulin and mucin (TIM-3) receptors, also caused a more elevated and higher quality CD8(+) T cell response to HSV particularly in the acute phase. Such sugar treated infected mice also had expanded populations of effector as well as memory CD8(+) T cells. The increased effector T cell responses led to significantly more efficient virus control. The mechanisms responsible for the outcome of the Gal-9/TIM-3 interaction in normal infected mice involved direct inhibitory effects on TIM-3(+) CD8(+) T effector cells as well as the promotion of Foxp3(+) regulatory T cell activity. Our results indicate that manipulating galectin signals, as can be achieved using appropriate sugars, may represent a convenient and inexpensive approach to enhance acute and memory responses to a virus infection.


Conflict of interest statement

The authors have declared that no competing interests exist.

Figures

Figure 1
Figure 1. TIM-3 expression is up regulated on virus-specific CD8+ T cells after HSV infection.
C57BL/6 animals were infected in each hind footpad with 2.5×10⁵ PFU of HSV. At different time points after infection, draining popliteal LNs (PLNs) cells isolated from three animals at each time point were analyzed flow cytometrically for TIM-3, Kb-gB-tetramer and IFN-γ staining. A. FACS plots showing the frequencies of TIM-3+ (upper panel), Kb-gB-Tet+ (middle panel) and SSIEFRAL-peptide stimulated IFN-γ producing (lower panel) CD8+ T cells are shown. Percentages (B) and absolute numbers (C) of TIM-3+, Kb-gB-Tet+ and SSIEFRAL-peptide stimulated IFN-γ producing CD8+ T cells in the draining PLN of HSV infected animals are shown. D. Co-expression of TIM-3 (upper panel) and Kb-gB-Tet (lower panel) with CD44 and CD62L is shown by representative FACS plots. E. FACS plots showing IFN-γ production by TIM-3+ (upper panel) and Kb-gB-Tet+ expression by TIM-3+CD8+ T cells are shown. F. Representative FACS plots show TIM-3 expression on Kb-gB-Tet+ (upper panel) and IFN-γ+CD8+ T (lower panel) cells G. FACS plots show the expression of TIM-3 (upper panel) and KLRG1 (lower panel) on IFN-γ producing CD8+ T cells.
Figure 2
Figure 2. TIM-3 is expressed on TCR stimulated CD8+ T cells.
C57BL/6 animals were injected i.v. with varying numbers of splenocytes isolated from P14 transgenic animals (Thy1.1) before infection with HSV. 5 days pi PLN and spleens were isolated and analyzed for the expression of TIM-3 on Kb-gB-Tet+ and Db-gp33-41-Tet+ CD8+ T cells. A-B. FACS plots showing the expression of TIM-3 on Kb-gb-Tet+ (A) and Db-gp33-41-Tet+ (B) isolated from PLN. C. Expression of TIM-3 on endogenous and donor Db-gp33-41-Tet+CD8+ T cells when varying numbers of P 14 cells were transferred.
Figure 3
Figure 3. Galectin-9 induces apoptosis of TIM-3 expressing CD8+ T cells in vitro and its expression is up regulated in the lymphoid organs after HSV infection.
PLNs single cell suspension isolated 6 dpi from HSV infected animals were incubated for 5 hr with varying concentrations of galectin-9 in the absence or the presence of α-lactose. The experiments were repeated multiple times with similar results. A. Representative FACS plots showing the expression of TIM-3 and annexin-V on gated CD8+ T cells under indicated incubation conditions are shown. B. The bar diagram shows the numbers of TIM-3+CD8+ T cells as calculated from A. C. Representative FACS plots showing the expression of Kb-gB-Tet and annexin-V on gated CD8+ T cells under indicated incubation conditions are shown. D. The bar diagram shows the numbers of TKb-gB-Tet+CD8+ T cells as calculated from C. E. TIM-3 and annexin-V expression on gated CD8+ T cells isolated from PLNs of HSV infected mice at 6 dpi and incubated for 5 hr with different concentrations of galectin-3 is shown. F. The bar diagram shows the numbers of TIM-3+CD8+ T cells as calculated from E. G. Immunoblots showing galectin-9 expression in the homogenates of isolated PLNs (upper panel) and spleens (middle panel) obtained from HSV infected animals at different time points are shown. Expression of β-actin as sample loading control is shown in the bottom panel. (lane # 1, day 0; #2, day 2, #3, day 3.5, #4, day 5, #5, day 8 and #6, recombinant galectin-9). H. Galectin-9 concentrations as measured by sandwich ELISA using anti-Gal-9 mAb (1A2) in the PLN homogenates is shown. The experiments were performed three times and three animals were sacrificed at each time point.
Figure 4
Figure 4. Galectin-9 knockout animals mount stronger virus-specific CD8+ T cell responses in the acute phase.
Virus-specific CD8+ T cell responses were compared among age and gender matched HSV infected wild type (WT) and galectin-9 knockout (Gal-9 KO) animals at 5.5 dpi. The experiments were repeated three times with similar results. A. Representative FACS plots showing TIM-3 expression on CD8+ T cells isolated from the lymphoid organs of WT and Gal-9 KO animals. B. FACS plots showing the co-expression of TIM-3 and Kb-gB-Tet in WT and Gal-9 KO animals. C. Histograms show the expression of CD62L and CD44 on CD8+ T cells isolated from the PLNs of infected WT (thin lines) and Gal-9 KO (thick lines) animals. D. Representative FACS plots show the frequencies of SSIEFARL peptide-stimulated IFN-γ and TNF-α producing CD8+ T cells isolated from the PLNs of WT and Gal-9KO animals. E & F. The measurement of frequencies (E) and absolute numbers (F) of TIM-3+, Kb-gB-Tet+, IFN-γ and TNF-α producing CD8+ T cells isolated from the PLNs of infected WT (n = 6) and Gal-9 KO (n = 7) animals as described in A-D are shown. G. The bar diagram shows the ratios of SSIEFARL stimulated IFN-γ+TNF-α+ to IFN- γ+ CD8+ T cells isolated from PLNs of infected WT and Gal-9KO mice as depicted by FACS plots in D. H. The MFI of cytokines produced by CD8+ T cells is shown. I. Viral titers obtained from footpad tissues at 5.5 days pi of WT and Gal-9 KO are shown. J-N. Spleens of HSV infected WT and Gal-9 KO animals were analyzed for the measurement of tetramer+ CD8+ T cells (J-L) and their ability to kill peptide pulsed splenocytes (M and N) 11 dpi. Syngenic splenocytes were pulsed with SSIEFARL-peptide and labeled with high concentration (2.5 µM) of CFSE. As a control of antigen specificity, un-pulsed cells were labeled with low concentration (0.25 µM) of CFSE. 107 cells of each type (CFSEhi and CFSElo) in 1∶1 ratio were transferred into in HSV infected WT and Gal-9 KO animals at 11 dpi. 2 hr post infusion, PBMCs and spleen cells were prepared from each animal and samples were acquired on FACS caliber and analysed by Flowjo software. The percentage of specific cell killing was determined as described in Materials and Methods section. The frequencies (J and K) and numbers (L) of Kb-gB-tet+ CD8+ T cells in the spleens of WT and Gal-9 KO animals at day 11 pi are shown. M. Representative FACS plots for the percentages of CFSEhi and CFSElo cells are shown. N. The bar diagrams show the percent specific lysis in the spleens of recipients.
Figure 5
Figure 5. Galectin-9 KO animals develop sustained virus-specific CD8+ T cells memory responses.
The lymphoid organs of HSV infected WT and Gal-9 KO animals were analyzed at day 32 or day 60 after infection for early and long-term memory responses using Kb-gB-tetramer and ICCS assays. All but long term memory experiments were repeated at least three times with four animals per group. A. Representative FACS plots showing the frequencies of Kb-gB-Tet+ cells in the spleens of WT and Gal-9 KO animals at 60 dpi. B. Representative FACS plots showing the frequencies of SSIEFARL peptide stimulated IFN-γ and TNF-α producing CD8+ T cells at 60 dpi. C. Bar diagram show the absolute numbers of Kb-gB-Tet+ and IFN-γ producing CD8+ T cells in the spleens of WT and Gal-9 KO animals as depicted by FACS plots in A and B at day 60. D. The bar diagram shows the ratio of SSIEFARL stimulated IFN-γ+TNF-α+ to IFN-γ+ CD8+ T cells isolated from WT and Gal-9 KO mice at 60 dpi. E-J. The animals previously infected with HSV for 32 days were re-infected with the same dose of HSV in footpads and the virus-specific CD8+ T cells responses were quantified in the PLN 2.5 dpi. E. Representative FACS plots show the frequencies of Kb-gB-Tet+ CD8+ T cells in the PLNs of WT (n = 4) and Gal-9 KO (n = 4) animals. F. Representative FACS plots show the frequencies of SSIFERAL-stimulated IFN-γ and TNF-α producing CD8+ T cell in the PLNs of WT (n = 4) and Gal-9 KO (n = 4) animals. G-H. The bar diagram shows the frequencies (G) and numbers (H) of Kb-gB-Tet+ and cytokines producing CD8+ T cells as depicted by FACS plots in E and F. I. MFI of cytokines produced by stimulated CD8+ T cell is shown. J. The peptide-specific proliferative response of PLNs cells isolated from re-infected animals at 2.5dpi is shown.
Figure 6
Figure 6. Galectin-9 deficiency extrinsically influences the virus-specific CD8+ T cell responses.
Splenocytes (having 1×10⁶ of CD8+ T cells) isolated from either WT or Gal-9 KO animals after labeling with CFSE were transferred in WT Thy1.1 animals (n = 4 for each recipient) (A-C). Alternatively, CFSE labeled splenocytes (having 1×10⁶ of CD8+ T cells) isolated from Thy1.1 animals were transferred either in WT or in Gal-9 KO animals (D-E). The recipients were infected with 2.5×10⁵ HSV in footpad after 24 hr pi. Five dpi spleens and PLN cell suspensions were analyzed for the dilution of CFSE in transferred Thy1.2+ or Thy1.1+CD8+ T cells. A. FACS plots show the frequencies of transferred Thy1.2+ WT or the Gal-9 KO cells in the PLNs of Thy1.1 animals 5 dpi B. The representative histograms showing the extent of CFSE dilution in the transferred WT or the Gal-9 KO cells (gated on Thy1.2+CD8+ T cells as shown in A). C. Absolute numbers of the transferred Thy1.2+ CD8+ T cells WT or the Gal-9 KO cells in the PLNs of recipients. D. The extent of CFSE dilution in the transferred Thy1.1+CD8+ T cells isolated 5dpi from WT and Gal-9 KO animals. E. FACS plots show the co-expression of Kb-gB-Tet and CFSE in the dividing transferred Thy1.1+CD8+ T cells isolated from WT and Gal-9 KO animals. F. Purified CD8+ T cells (90% purity) from WT and Gal-9 KO animals after CFSE labeling were stimulated with plate bound anti-CD3 and CD28 mAb for 3 days and the extent of proliferation was measured by CFSE dilution in CD8+ T cells. Red lines show the CFSE staining in Gal-9 KO, Black thick lines show the CFSE staining in WT cells and black thin lines represent CFSE staining in un-stimulated cells. G-L. The lymphoid organs of infected WT and Gal-9 KO animals at 6 dpi were isolated and Foxp3+CD4+ T cells were characterized. G. FACS plots show the frequencies of Foxp3+ Tregs in PLNs (upper panel) and spleens (lower panel) of WT and Gal-9 KO. The percentages (H), MFI of Foxp3 expression on Foxp3+CD4+ Tregs isolated from PLN (I) and spleens (J) of WT and Gal-9 KO animals are shown. K-L. The frequencies of CD103+ (K) and TIM-3+ (L) Foxp3+ Tregs isolated from the draining PLNs (upper panel) and Spleens (lower panel) of WT and Gal-9 KO animals are shown. M. The expression of CD44 on Foxp3+CD4+ T cells isolated from the PLNs (upper panel) and spleens (lower panel) of WT (thin lines) and Gal-9 KO (thicker lines) animals.
Figure 7
Figure 7. Administration of α-lactose solution in mice after HSV infection enhances the magnitude and quality of HSV-specific CD8+ T cells responses.
C57B/6 animals were infected in each footpad with 2.5×10⁵ pfu of HSV and divided into groups. Animals were treated with different doses (27 mM, 137 mM, 277 mM, 416 mM) of α-lactose from day 3 until day 5 and those in the other group were given PBS. 12 hrs after last administration, animals were sacrificed and virus specific CD8+ T cell responses were quantified. A. Effect of different doses of α-lactose on the magnitude of virus-specific CD8+ T cells is shown. B. Representative FACS plots showing the frequencies of IFN-γ and TNF-α producing CD8+ T cells isolated from the PLN (upper panel) and spleen (lower panel) of α-lactose (277 mM) treated (n = 4) and control (n = 6) animals are shown. C. Expression of TIM-3 and CD62L (upper panel), TIM-3 and KLRG1 (middle panel) and Kb-gB-Tet on CD8+ T cells isolated from control and α-lactose treated animals are shown. D-E. Frequencies (D) and absolute numbers (E) of IFN-γ producing CD8+ T cells as depicted by FACS plots in B are shown. F. The bar diagram shows the ratio of SSIEFARL stimulated IFN-γ+TNF-α+ to IFN-γ+ CD8+ T cell. G. Viral titers in the footpad tissues of α-lactose treated and control animals are shown. H-J. HSV infected animals were given 277 mM α-lactose ip day 1 until day 7 and their CD8+ T cell responses were compared with that of control animals at 30 dpi. The frequencies (H) and numbers (I) of Kb-gB-Tet+CD8+ T cells are shown. J-L. The frequencies (J and K) and absolute numbers (L) of SSIEFARL stimulated IFN-γ and TNF-α producing CD8+ T cells isolated form control (n = 4) and α-lactose treated (n = 4) animals are shown.
Figure 8
Figure 8. Administration of α-lactose diminishes regulatory T cells responses.
LN cells and splenocytes isolated from HSV infected animals that were either treated with α-lactose or controls as described in Fig 4, were analyzed for the expression of activation markers and activity. A-C. FACS plots depicting the expression (% positive (A and B) and MFI (C) of TIM-3 on gated CD4+Foxp3+ T cells in the control and α-lactose treated animals are shown. D-F. FACS plots showing the expression (% positive (D and E) and MFI (F) of CD103 on gated CD4+Foxp3+ T cells in the control and α-lactose treated animals are shown. G. The suppressive activity of Tregs is reduced after α-lactose treatment. Foxp3-GFP Knock-in animals were infected with HSV and divided into two groups. One group was treated with α-lactose (277mM solution) and the other group of animals was left untreated. GFP+ cells were sorted after 6 days of HSV infection and co-cultured with CFSE labeled Thy1.1 CD4+CD25- cells and T cell depleted splenocytes isolated from uninfected animals Thy1.1 B/6 animals. FACS plots (G) show the extent of dilution of CFSE as an indicator of proliferation in Thy1.1+CD4+and its inhibition in the presence of Tregs. CFSE staining in un-stimulated cells (faint line), stimulated cells in the presence of Tregs isolated from control animals (thinner line) and stimulated cells in the presence of Tregs isolated from α-lactose treated animals (thickest line) are shown.
Figure 9
Figure 9. Administration of galectin-9 during the expansion phase after HSV infection diminishes the magnitude of virus-specific CD8+ T cell responses.
C57B/6 animals (n = 10) were infected in each footpad with 2.5×10⁵ PFU of HSV and divided into two groups. Animals in one of the groups were treated with 125 µg of Gal-9 from day 3 until day 5 and those in the other group were given PBS. 12 hr after last injection, animals were sacrificed and single cell suspensions of their PLNs and spleens were analyzed flow cytometrically for virus specific CD8+ T cell responses (surface staining and SSIEFARL peptide stimulated intracellular IFN-γ and TNF-α producing CD8 T cells). A. Representative FACS plots for surface staining of CD8+ T cells isolated from the PLNs for the expression of TIM-3, CD44, CD62L and Kb-gB-Tet+ in Gal-9 treated and control animals are shown. B. Representative FACS plots for the frequencies of peptide stimulated IFN-γ and TNF-α producing CD8+ T cells in the PLN (upper panel) and spleens (lower panel) are shown. C-D. Frequencies (C) as well as absolute numbers (D) of CD8+ T cells positive for TIM-3, KB-gb-Tet, IFN-γ and TNF-α isolated from PLNs of control and treated mice are shown. E. The viral titers in the footpads of control and treated animals 12 hrs after last injection as quantified by standard plaque assays are shown. The experiments were performed two times with 5 animals per group each time.

Similar articles

Cited by

References

    1. Zinkernagel RM. Immunology taught by viruses. Science. 1996;271:173–178. - PubMed
    1. Ahmed R, Gray D. Immunological memory and protective immunity: understanding their relation. Science. 1996;272:54–60. - PubMed
    1. Gandhi RT, Walker BD. Immunologic control of HIV-1. Annu Rev Med. 2002;53:149–172. - PubMed
    1. Rabinovich GA, Toscano MA. Turning ‘sweet’ on immunity: galectin-glycan interactions in immune tolerance and inflammation. Nat Rev Immunol. 2009;9:338–352. - PubMed
    1. Mercier S, St-Pierre C, Pelletier I, Ouellet M, Tremblay MJ, et al. Galectin-1 promotes HIV-1 infectivity in macrophages through stabilization of viral adsorption. Virology. 2008;371:121–129. - PubMed

Publication types

MeSH terms