. 2010 Aug 1;19(15):2974-86.
doi: 10.1093/hmg/ddq202. Epub 2010 May 11.

ALS-linked mutant SOD1 damages mitochondria by promoting conformational changes in Bcl-2

Affiliations

ALS-linked mutant SOD1 damages mitochondria by promoting conformational changes in Bcl-2

Steve Pedrini et al. Hum Mol Genet. .

Abstract

In mutant superoxide dismutase (SOD1)-linked amyotrophic lateral sclerosis (ALS), accumulation of misfolded mutant SOD1 in spinal cord mitochondria is thought to cause mitochondrial dysfunction. Whether mutant SOD1 is toxic per se or whether it damages the mitochondria through interactions with other mitochondrial proteins is not known. We previously identified Bcl-2 as an interacting partner of mutant SOD1 specifically in spinal cord, but not in liver, mitochondria of SOD1 mice and patients. We now show that mutant SOD1 toxicity relies on this interaction. Mutant SOD1 induces mitochondrial morphological changes and compromises mitochondrial membrane integrity leading to release of Cytochrome C only in the presence of Bcl-2. In cells, mouse and human spinal cord with SOD1 mutations, the binding to mutant SOD1 triggers a conformational change in Bcl-2 that results in the uncovering of its toxic BH3 domain and conversion of Bcl-2 into a toxic protein. Bcl-2 carrying a mutagenized, non-toxic BH3 domain fails to support mutant SOD1 mitochondrial toxicity. The identification of Bcl-2 as a specific target and active partner in mutant SOD1 mitochondrial toxicity suggests new therapeutic strategies to inhibit the formation of the toxic mutant SOD1/Bcl-2 complex and to prevent mitochondrial damage in ALS.


Figures

Figure 1.
Figure 1.
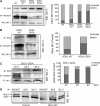
In isolated mitochondria, mutSOD1 induces Cytochrome C release only in the presence of Bcl-2. (A) Mitochondria isolated from mouse spinal cord were incubated with 1 mm of recombinant SOD1 (WT, G93A and A4V) for 30 min. Samples were then ultracentrifuged and the mitochondrial (mitopellet) and cytosolic (supernatant) fractions analyzed by WB with an anti-Cytochrome C antibody. Only mutSOD1 reduces Cytochrome C in the mitopellet and increases it in the supernatant fraction. (B) Bcl-2 negative or Bcl-2 positive mitochondria isolated from HEK293T cells were incubated with recombinant SOD1-G93A as above and Cytochrome C levels measured in supernatant by ELISA (left panel) and mitopellet by WB (right-upper panel). ELISA data are mean ± SEM of four independent experiments. Mitopellet shows a representative WB. Data were also confirmed with SOD1-A4V-treated mitochondria and analyzed by WB (right-lower panel). CaCl2 was used as control for maximal loss of mitochondrial integrity.
Figure 2.
Figure 2.
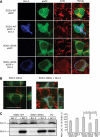
Co-expression of Bcl-2 and mutant, but not SOD1-WT, damages the mitochondria. (A) Mitochondrial integrity was assessed by confocal microscopy analysis of HEK293T cells transfected with SOD1-eGFP (WT or G93A) in the presence or absence of Bcl-2 and stained with anti-Cytochrome C antibody. For each experiment (n = 4), 10 fields of vision were randomly photographed and the percentage of cells co-expressing mutSOD1 (green) and Bcl-2 (blue) with damaged mitochondria was counted. Approximately 85% of cells show damaged mitochondria with diffuse Cytochrome C staining. In cells expressing SOD1-G93A alone, Cytochrome C staining is punctuate, indicative of structurally intact mitochondria. In 98% of SOD1-WT-positive cells, either in the presence or absence of Bcl-2, staining of Cytochrome C is punctuate (intact mitochondria). Scale bar 20 μm. (B) z-stack orthogonal views are shown to confirm mitochondrial integrity and Cytochrome C staining within the cell. Scale bar 20 μm. (C) Representative WB of mitochondrial Cytochrome C. Mitochondria were isolated from HEK293T cells and the total amount of Cytochrome C retained and/or released from the mitopellet assessed by WB. MutSOD1 and Bcl-2 induce a decrease of Cytochrome C in mitochondria, whereas expression of either molecule alone does not (top lane). Efficiency of transfection was evaluated by probing for Bcl-2 (bottom lane). The histogram shows intensity of Cytochrome C staining in mitopellet measured by densitometric analysis using the Biorad Chemidoc Quantity One software. Data are mean (mean + SEM) of three independent experiments. Student's t-test shows statistically significant differences between experimental groups. EV = empty vector.
Figure 3.
Figure 3.
Co-expression of SOD1-G93A and Bcl-2 induces mitochondrial structural damage. (A) Electron microscopy analysis of mitochondrial structure in HEK293T transfected with SOD1-WT (panels C and D), SOD1-G93A (panels E and F) without (upper panels A, C and E) or with (lower panels B, D and F) Bcl-2. Cells transfected with SOD1-G93A alone show structurally normal mitochondria (panel E), whereas co-expression of Bcl-2 and SOD1-G93A causes morphological changes as shown by extensive internal vacuolization and cristae disorganization (panel F). Images are representative of four experiments. (B) Transfection efficiency and expression levels of SOD1-eGFP and Bcl-2 among different experimental groups were assessed by WB with an anti-eGFP and Bcl-2 antibody, respectively.
Figure 4.
Figure 4.
MutSOD1s induce a conformational change in Bcl-2 leading to exposure of the toxic BH3 domain in cells, mouse and human spinal cords. (A) SH-SY5Y cells, which express endogenous Bcl-2, were transfected with SOD1 (WT, G37R or G93A) and Bcl-2 conformation assessed by immunoprecipitation with the α-Bcl-2/BH3 and α-Bcl-2/pocket antibody, respectively. Immunoprecipitated proteins were analyzed by WB with anti-Bcl-2 antibody against the N-terminal domain (left panel). Total amount of Bcl-2 was assessed by WB (left panel, bottom lane). In the presence of mutSOD1s (G37R and G93A), there is an increased exposure of the toxic BH3 domain paralleled by a decrease in the pocket region. The plot in the right panel shows the ratio BH3/pocket as analyzed by densitometric analysis of the immunoprecipitated Bcl-2 with the Quantity One software. (B) The α-Bcl-2/BH3 and α-Bcl-2/pocket antibodies were used to immunoprecipitate Bcl-2 from spinal cord homogenates of 130-day-old transgenic mice expressing either SOD1-WT or SOD1-G93A. In SOD1-G93A mice there is an increased exposure of the toxic BH3 domain of Bcl-2 compared with age-matched transgenic SOD1-WT mice, and this is paralleled by a decreased exposure of the pocket. (C) Conformational changes in Bcl-2 were then assessed over time in the SOD1-G93A mice. Exposure of the toxic BH3 domain appears prior to and peaks at disease onset (left panel). Densitometry analysis of the ratio BH3/pocket is shown in the plot on the right. (D) Immunoprecipitation of post-mortem human SOD1-A4V spinal cord shows increased exposure of the BH3 domain (shown as *) paralleled by a decreased exposure of the pocket region in human ALS.
Figure 5.
Figure 5.
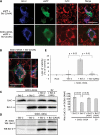
BH3-inactive Bcl-2 abolishes mutSOD1 mitochondrial toxicity. (A) Representative confocal images. HEK293T cells were transfected with SOD1-G93A eGFP in the presence or absence of Bcl-2(AAA) for 24 h and mitochondrial integrity assessed by staining with the anti-Cytochrome C antibody. When co-transfected with Bcl-2(AAA), SOD1-G93A loses its toxicity on mitochondria and does not trigger a release of Cytochrome C. Scale bar 20 μm. (B) Mitochondrial integrity was also assessed with z-stack orthogonal views. Scale bar 20 μm. (C) Cytochrome C release from damaged mitochondria was confirmed biochemically. Mitochondria were isolated from HEK293T cells co-transfected with SOD1-G93A and Bcl-2(AAA) and the amount of mitochondrial Cytochrome C measured in the mitopellet by WB. Cytochrome C is retained in the mitochondria in cells with SOD1-G93A and Bcl-2(AAA) (top lane), indicating only little or no damage to the mitochondria. Efficiency of transfection was evaluated by probing for Bcl-2 (bottom lane). The histogram in the right panel shows the results of densitometric analysis of mitochondrial Cytochrome C staining. Data are mean (mean + SEM) of four experiments. Student's t-test shows statistically significant differences between experimental groups. (D) Bcl-2(AAA) retains its binding properties with SOD1-G93A. HEK293T cells were co-transfected with SOD1-G93A and either Bcl-2 or Bcl-2(AAA), lysed and immunoprecipitated with the anti-SOD1 antibody. Binding to Bcl-2 was determined by WB (top lane). Efficiency of transfection was evaluated by probing for Bcl-2 (bottom lane). (E) HEK293T cells were transfected with an empty vector (Mock), SOD1-G93A alone or in combination with Bcl-2 or Bcl-2(AAA). SOD1-G93A induces a loss of viability in the presence of BH3-active Bcl-2, but not in cells in which the BH3 domain is inactive. Student's t-test was performed to determine differences between groups.
Figure 6.
Figure 6.
Anchoring of Bcl-2 to mitochondria is necessary for mutSOD1-induced toxicity. (A) HEK293T cells were co-transfected with SOD1-G93A and either Bcl-2 or Bcl-2 lacking the transmembrane domain (Bcl-2 ΔTM). When co-transfected with Bcl-2 ΔTM, which does not localize in mitochondria (diffuse blue staining), SOD1-G93A does no longer induce release of Cytochrome C. Efficiency of the transfection was evaluated by WB probing for Bcl-2. The integrity of mitochondria was also assessed by confocal analysis with z-stack orthogonal views (right). (B). HEK293T cells were transfected with empty vector (Mock), SOD1-G93A alone or in combination with Bcl-2 or Bcl-2 ΔTM. SOD1-G93A induces a loss of viability in the presence of Bcl-2, but not in Bcl-2 ΔTM-positive cells. Student's t-test shows statistically significant differences between experimental groups.

Similar articles

Cited by

References

    1. Pasinelli P., Brown R.H. Molecular biology of amyotrophic lateral sclerosis: insights from genetics. Nat. Rev. Neurosci. 2006;7:710–723. doi:10.1038/nrn1971. - DOI - PubMed
    1. Rosen D.R., Siddique T., Patterson D., Figlewicz D.A., Sapp P., Hentati A., Donaldson D., Goto J., O'Regan J.P., Deng H.X., et al. Mutations in Cu/Zn superoxide dismutase gene are associated with familial amyotrophic lateral sclerosis. Nature. 1993;362:59–62. doi:10.1038/362059a0. - DOI - PubMed
    1. Higgins C.M., Jung C., Ding H., Xu Z. Mutant Cu, Zn superoxide dismutase that causes motoneuron degeneration is present in mitochondria in the CNS. J. Neurosci. 2002;22:RC215. - PMC - PubMed
    1. Jaarsma D., Rognoni F., van Duijn W., Verspaget H.W., Haasdijk E.D., Holstege J.C. CuZn superoxide dismutase (SOD1) accumulates in vacuolated mitochondria in transgenic mice expressing amyotrophic lateral sclerosis-linked SOD1 mutations. Acta Neuropathol. 2001;102:293–305. - PubMed
    1. Liu J., Lillo C., Jonsson P.A., Vande Velde C., Ward C.M., Miller T.M., Subramaniam J.R., Rothstein J.D., Marklund S., Andersen P.M., et al. Toxicity of familial ALS-linked SOD1 mutants from selective recruitment to spinal mitochondria. Neuron. 2004;43:5–17. doi:10.1016/j.neuron.2004.06.016. - DOI - PubMed

Publication types