

Effects of the English (H6R) and Tottori (D7N) familial Alzheimer disease mutations on amyloid beta-protein assembly and toxicity
- PMID: 20452980
- PMCID: PMC2906312
- DOI: 10.1074/jbc.M109.086496
Effects of the English (H6R) and Tottori (D7N) familial Alzheimer disease mutations on amyloid beta-protein assembly and toxicity
Abstract
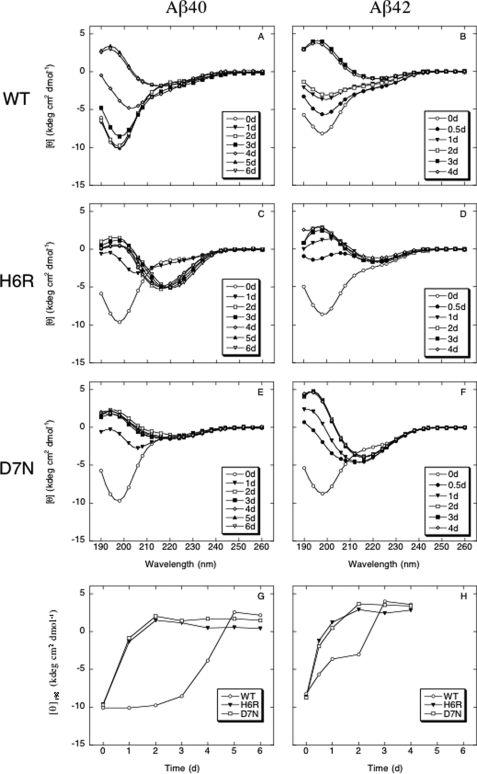
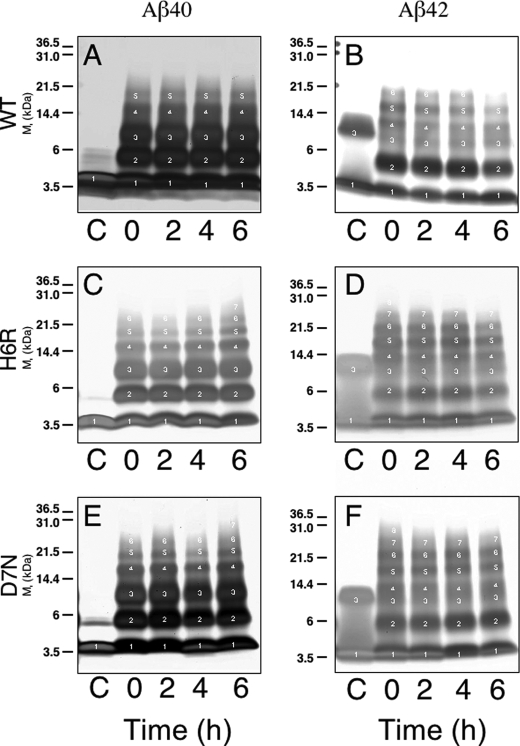
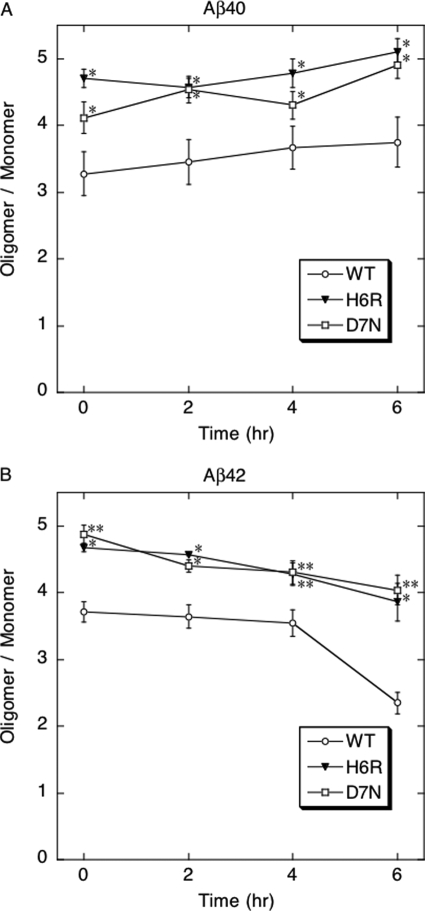
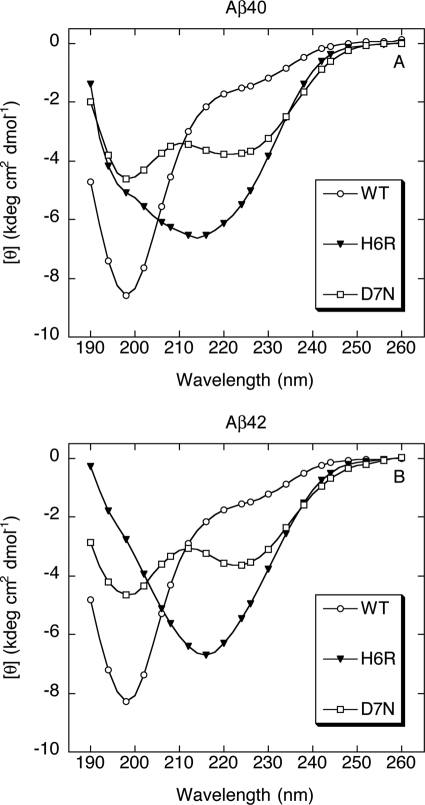
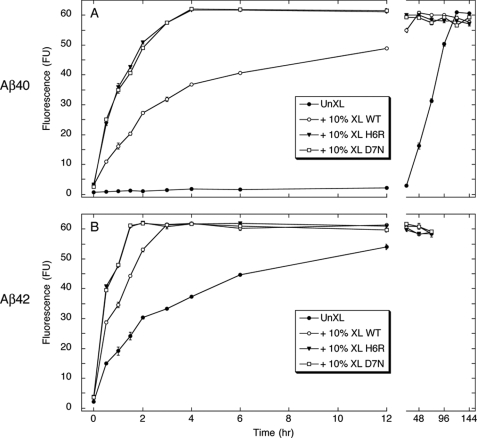
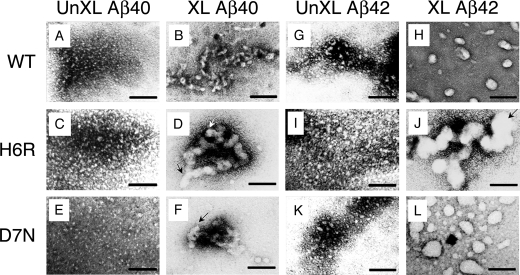
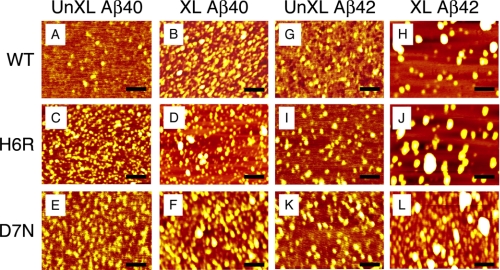
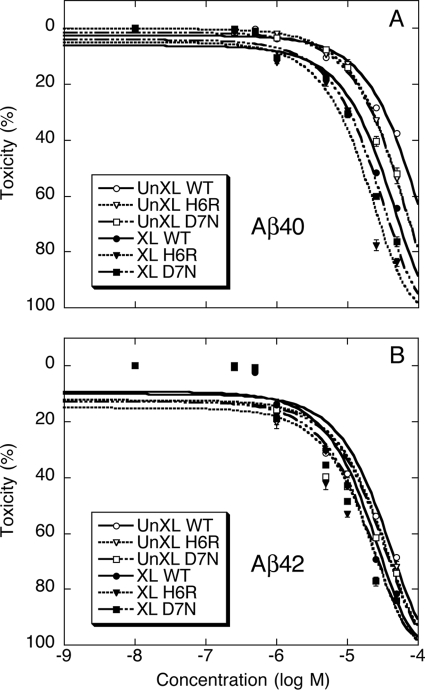
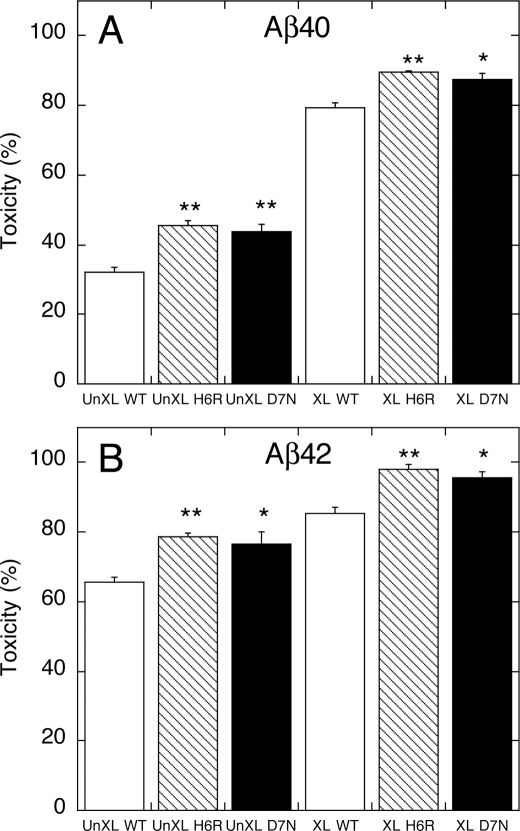
Mutations in the amyloid beta-protein (Abeta) precursor gene cause autosomal dominant Alzheimer disease in a number of kindreds. In two such kindreds, the English and the Tottori, the mutations produce amyloid beta-proteins containing amino acid substitutions, H6R and D7N, respectively, at the peptide N terminus. To elucidate the structural and biological effects of the mutations, we began by examining monomer conformational dynamics and oligomerization. Relative to their wild type homologues, and in both the Abeta40 and Abeta42 systems, the English and Tottori substitutions accelerated the kinetics of secondary structure change from statistical coil --> alpha/beta --> beta and produced oligomer size distributions skewed to higher order. This skewing was reflected in increases in average oligomer size, as measured using electron microscopy and atomic force microscopy. Stabilization of peptide oligomers using in situ chemical cross-linking allowed detailed study of their properties. Each substitution produced an oligomer that displayed substantial beta-strand (H6R) or alpha/beta (D7N) structure, in contrast to the predominately statistical coil structure of wild type Abeta oligomers. Mutant oligomers functioned as fibril seeds, and with efficiencies significantly higher than those of their wild type homologues. Importantly, the mutant forms of both native and chemically stabilized oligomers were significantly more toxic in assays of cell physiology and death. The results show that the English and Tottori mutations alter Abeta assembly at its earliest stages, monomer folding and oligomerization, and produce oligomers that are more toxic to cultured neuronal cells than are wild type oligomers.
Figures
Similar articles
-
Effect of the Tottori familial disease mutation (D7N) on the monomers and dimers of Aβ40 and Aβ42.ACS Chem Neurosci. 2013 Nov 20;4(11):1446-57. doi: 10.1021/cn400110d. Epub 2013 Sep 16. ACS Chem Neurosci. 2013. PMID: 24041307 Free PMC article. Clinical Trial.
-
The Tottori (D7N) and English (H6R) familial Alzheimer disease mutations accelerate Abeta fibril formation without increasing protofibril formation.J Biol Chem. 2007 Feb 16;282(7):4916-4923. doi: 10.1074/jbc.M608220200. Epub 2006 Dec 14. J Biol Chem. 2007. PMID: 17170111
-
Dual effects of familial Alzheimer's disease mutations (D7H, D7N, and H6R) on amyloid β peptide: correlation dynamics and zinc binding.Proteins. 2014 Dec;82(12):3286-97. doi: 10.1002/prot.24669. Epub 2014 Oct 21. Proteins. 2014. PMID: 25137638
-
Role of the region 23-28 in Abeta fibril formation: insights from simulations of the monomers and dimers of Alzheimer's peptides Abeta40 and Abeta42.Curr Alzheimer Res. 2008 Jun;5(3):244-50. doi: 10.2174/156720508784533330. Curr Alzheimer Res. 2008. PMID: 18537541 Review.
-
The biogenesis and biology of amyloid β oligomers in the brain.Alzheimers Dement. 2020 Nov;16(11):1561-1567. doi: 10.1002/alz.12084. Epub 2020 Jun 16. Alzheimers Dement. 2020. PMID: 32543725 Free PMC article. Review.
Cited by
-
Beta-amyloid induces apoptosis of neuronal cells by inhibition of the Arg/N-end rule pathway proteolytic activity.Aging (Albany NY). 2019 Aug 24;11(16):6134-6152. doi: 10.18632/aging.102177. Epub 2019 Aug 24. Aging (Albany NY). 2019. PMID: 31446431 Free PMC article.
-
The Alzheimer disease protective mutation A2T modulates kinetic and thermodynamic properties of amyloid-β (Aβ) aggregation.J Biol Chem. 2014 Nov 7;289(45):30977-89. doi: 10.1074/jbc.M114.599027. Epub 2014 Sep 24. J Biol Chem. 2014. PMID: 25253695 Free PMC article.
-
Oligomers Are Promising Targets for Drug Development in the Treatment of Proteinopathies.Front Mol Neurosci. 2020 Jan 31;12:319. doi: 10.3389/fnmol.2019.00319. eCollection 2019. Front Mol Neurosci. 2020. PMID: 32076398 Free PMC article.
-
Combined High-Pressure and Multiquantum NMR and Molecular Simulation Propose a Role for N-Terminal Salt Bridges in Amyloid-Beta.J Phys Chem Lett. 2021 Oct 14;12(40):9933-9939. doi: 10.1021/acs.jpclett.1c02595. Epub 2021 Oct 7. J Phys Chem Lett. 2021. PMID: 34617758 Free PMC article.
-
The domestic cat as a natural animal model of Alzheimer's disease.Acta Neuropathol Commun. 2015 Dec 10;3:78. doi: 10.1186/s40478-015-0258-3. Acta Neuropathol Commun. 2015. PMID: 26651821 Free PMC article.
References
-
- Teplow D. B. (1998) Amyloid 5, 121–142 - PubMed
-
- Selkoe D. J. (2004) Ann. Intern. Med. 140, 627–638 - PubMed
-
- Bertram L., Tanzi R. E. (2008) Nat. Rev. Neurosci. 9, 768–778 - PubMed
-
- Borchelt D. R., Thinakaran G., Eckman C. B., Lee M. K., Davenport F., Ratovitsky T., Prada C. M., Kim G., Seekins S., Yager D., Slunt H. H., Wang R., Seeger M., Levey A. I., Gandy S. E., Copeland N. G., Jenkins N. A., Price D. L., Younkin S. G., Sisodia S. S. (1996) Neuron 17, 1005–1013 - PubMed
