

Inclusion of neighboring base interdependencies substantially improves genome-wide prokaryotic transcription factor binding site prediction
- PMID: 20439311
- PMCID: PMC2896541
- DOI: 10.1093/nar/gkq274
Inclusion of neighboring base interdependencies substantially improves genome-wide prokaryotic transcription factor binding site prediction
Abstract
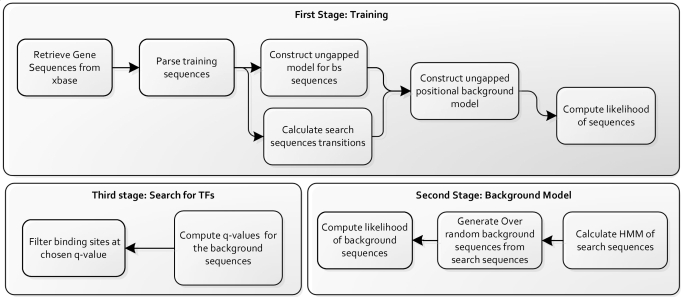
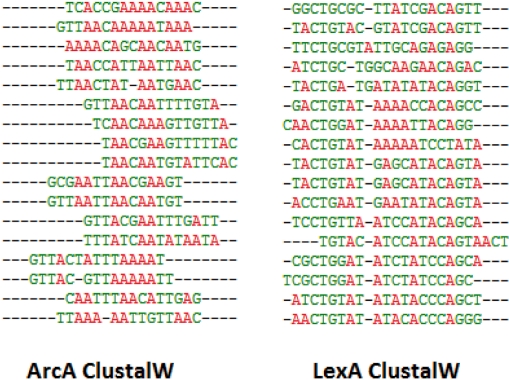
Prediction of transcription factor binding sites is an important challenge in genome analysis. The advent of next generation genome sequencing technologies makes the development of effective computational approaches particularly imperative. We have developed a novel training-based methodology intended for prokaryotic transcription factor binding site prediction. Our methodology extends existing models by taking into account base interdependencies between neighbouring positions using conditional probabilities and includes genomic background weighting. This has been tested against other existing and novel methodologies including position-specific weight matrices, first-order Hidden Markov Models and joint probability models. We have also tested the use of gapped and ungapped alignments and the inclusion or exclusion of background weighting. We show that our best method enhances binding site prediction for all of the 22 Escherichia coli transcription factors with at least 20 known binding sites, with many showing substantial improvements. We highlight the advantage of using block alignments of binding sites over gapped alignments to capture neighbouring position interdependencies. We also show that combining these methods with ChIP-on-chip data has the potential to further improve binding site prediction. Finally we have developed the ungapped likelihood under positional background platform: a user friendly website that gives access to the prediction method devised in this work.
Figures
Similar articles
-
A comparative analysis of genome-wide chromatin immunoprecipitation data for mammalian transcription factors.Nucleic Acids Res. 2006;34(21):e146. doi: 10.1093/nar/gkl803. Epub 2006 Nov 7. Nucleic Acids Res. 2006. PMID: 17090591 Free PMC article.
-
A general integrative genomic feature transcription factor binding site prediction method applied to analysis of USF1 binding in cardiovascular disease.Hum Genomics. 2009 Apr;3(3):221-35. doi: 10.1186/1479-7364-3-3-221. Hum Genomics. 2009. PMID: 19403457 Free PMC article.
-
CEAS: cis-regulatory element annotation system.Nucleic Acids Res. 2006 Jul 1;34(Web Server issue):W551-4. doi: 10.1093/nar/gkl322. Nucleic Acids Res. 2006. PMID: 16845068 Free PMC article.
-
Genome Wide Approaches to Identify Protein-DNA Interactions.Curr Med Chem. 2019;26(42):7641-7654. doi: 10.2174/0929867325666180530115711. Curr Med Chem. 2019. PMID: 29848263 Review.
-
Serial analysis of binding elements for transcription factors.Methods Mol Biol. 2009;567:113-32. doi: 10.1007/978-1-60327-414-2_8. Methods Mol Biol. 2009. PMID: 19588089 Review.
Cited by
-
BML: a versatile web server for bipartite motif discovery.Brief Bioinform. 2022 Jan 17;23(1):bbab536. doi: 10.1093/bib/bbab536. Brief Bioinform. 2022. PMID: 34974623 Free PMC article.
-
Knowledge-based three-body potential for transcription factor binding site prediction.IET Syst Biol. 2016 Feb;10(1):23-9. doi: 10.1049/iet-syb.2014.0066. IET Syst Biol. 2016. PMID: 26816396 Free PMC article.
-
Dose-sensitivity, conserved non-coding sequences, and duplicate gene retention through multiple tetraploidies in the grasses.Front Plant Sci. 2011 Mar 10;2:2. doi: 10.3389/fpls.2011.00002. eCollection 2011. Front Plant Sci. 2011. PMID: 22645525 Free PMC article.
-
Logic minimization and rule extraction for identification of functional sites in molecular sequences.BioData Min. 2012 Aug 16;5(1):10. doi: 10.1186/1756-0381-5-10. BioData Min. 2012. PMID: 22897894 Free PMC article.
-
Parametric bootstrapping for biological sequence motifs.BMC Bioinformatics. 2016 Oct 6;17(1):406. doi: 10.1186/s12859-016-1246-8. BMC Bioinformatics. 2016. PMID: 27716039 Free PMC article.
References
-
- Leblanc B, Moss T. DNase I footprinting. Methods Mol. Biol. 2001;148:31–38. - PubMed
-
- Aparicio O, Geisberg JV, Sekinger E, Yang A, Moqtaderi Z, Struhl K. Chromatin immunoprecipitation for determining the association of proteins with specific genomic sequences in vivo. Curr. Protoc. Mol. Biol. 2005;Chapter 21 Unit 21, 23. - PubMed
-
- Johnson DS, Mortazavi A, Myers RM, Wold B. Genome-wide mapping of in vivo protein–DNA interactions. Science. 2007;316:1497–1502. - PubMed
-
- Hall N. Advanced sequencing technologies and their wider impact in microbiology. J. Exp. Biol. 2007;210:1518–1525. - PubMed
-
- Tompa M, Li N, Bailey TL, Church GM, De Moor B, Eskin E, Favorov AV, Frith MC, Fu Y, Kent WJ, et al. Assessing computational tools for the discovery of transcription factor binding sites. Nat. Biotechnol. 2005;23:137–144. - PubMed
