

A three-dimensional model of the yeast genome
- PMID: 20436457
- PMCID: PMC2874121
- DOI: 10.1038/nature08973
A three-dimensional model of the yeast genome
Abstract
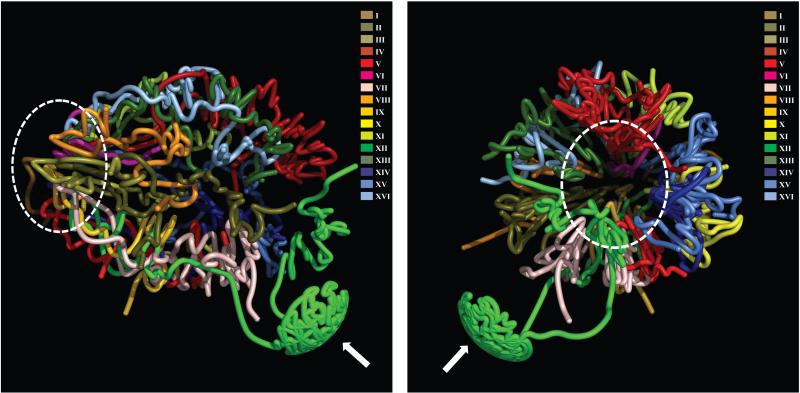
Layered on top of information conveyed by DNA sequence and chromatin are higher order structures that encompass portions of chromosomes, entire chromosomes, and even whole genomes. Interphase chromosomes are not positioned randomly within the nucleus, but instead adopt preferred conformations. Disparate DNA elements co-localize into functionally defined aggregates or 'factories' for transcription and DNA replication. In budding yeast, Drosophila and many other eukaryotes, chromosomes adopt a Rabl configuration, with arms extending from centromeres adjacent to the spindle pole body to telomeres that abut the nuclear envelope. Nonetheless, the topologies and spatial relationships of chromosomes remain poorly understood. Here we developed a method to globally capture intra- and inter-chromosomal interactions, and applied it to generate a map at kilobase resolution of the haploid genome of Saccharomyces cerevisiae. The map recapitulates known features of genome organization, thereby validating the method, and identifies new features. Extensive regional and higher order folding of individual chromosomes is observed. Chromosome XII exhibits a striking conformation that implicates the nucleolus as a formidable barrier to interaction between DNA sequences at either end. Inter-chromosomal contacts are anchored by centromeres and include interactions among transfer RNA genes, among origins of early DNA replication and among sites where chromosomal breakpoints occur. Finally, we constructed a three-dimensional model of the yeast genome. Our findings provide a glimpse of the interface between the form and function of a eukaryotic genome.
Figures
Similar articles
-
Chromosome positioning and the clustering of functionally related loci in yeast is driven by chromosomal interactions.Nucleus. 2012 Jul 1;3(4):370-83. doi: 10.4161/nucl.20971. Epub 2012 Jun 12. Nucleus. 2012. PMID: 22688649
-
The Rabl configuration limits topological entanglement of chromosomes in budding yeast.Sci Rep. 2019 May 1;9(1):6795. doi: 10.1038/s41598-019-42967-4. Sci Rep. 2019. PMID: 31043625 Free PMC article.
-
Centromere clustering is a major determinant of yeast interphase nuclear organization.J Cell Sci. 2000 Jun;113 ( Pt 11):1903-12. doi: 10.1242/jcs.113.11.1903. J Cell Sci. 2000. PMID: 10806101
-
Unravelling global genome organization by 3C-seq.Semin Cell Dev Biol. 2012 Apr;23(2):213-21. doi: 10.1016/j.semcdb.2011.11.003. Epub 2011 Nov 18. Semin Cell Dev Biol. 2012. PMID: 22120510 Free PMC article. Review.
-
Structure and function in the budding yeast nucleus.Genetics. 2012 Sep;192(1):107-29. doi: 10.1534/genetics.112.140608. Genetics. 2012. PMID: 22964839 Free PMC article. Review.
Cited by
-
High-throughput identification of long-range regulatory elements and their target promoters in the human genome.Nucleic Acids Res. 2013 May;41(9):4835-46. doi: 10.1093/nar/gkt188. Epub 2013 Mar 21. Nucleic Acids Res. 2013. PMID: 23525463 Free PMC article.
-
3C-based technologies to study the shape of the genome.Methods. 2012 Nov;58(3):189-91. doi: 10.1016/j.ymeth.2012.11.005. Methods. 2012. PMID: 23199640 Free PMC article. No abstract available.
-
The yeast genome undergoes significant topological reorganization in quiescence.Nucleic Acids Res. 2015 Sep 30;43(17):8299-313. doi: 10.1093/nar/gkv723. Epub 2015 Jul 21. Nucleic Acids Res. 2015. PMID: 26202961 Free PMC article.
-
Mining 3D genome structure populations identifies major factors governing the stability of regulatory communities.Nat Commun. 2016 May 31;7:11549. doi: 10.1038/ncomms11549. Nat Commun. 2016. PMID: 27240697 Free PMC article.
-
Synthetic yeast chromosome XI design provides a testbed for the study of extrachromosomal circular DNA dynamics.Cell Genom. 2023 Nov 9;3(11):100418. doi: 10.1016/j.xgen.2023.100418. eCollection 2023 Nov 8. Cell Genom. 2023. PMID: 38020971 Free PMC article.
References
-
- Misteli T. Beyond the sequence: cellular organization of genome function. Cell. 2007;128:787–800. - PubMed
-
- Lanctot C, Cheutin T, Cremer M, Cavalli G, Cremer T. Dynamic genome architecture in the nuclear space: regulation of gene expression in three dimensions. Nature Rev. Genet. 8:104–115. - PubMed
-
- Heun P, Laroche T, Shimada K, Furrer P, Gasser SM. Chromosome dynamics in the yeast interphase nucleus. Science. 2001;294:2181–2186. - PubMed
-
- Gasser SM. Visualizing chromatin dynamics in interphase nuclei. Science. 2002;296:1412–1416. - PubMed
Publication types
MeSH terms
Substances
Grants and funding
LinkOut - more resources
Full Text Sources
Other Literature Sources
Molecular Biology Databases
