The BH3-only Bnip3 binds to the dynamin Opa1 to promote mitochondrial fragmentation and apoptosis by distinct mechanisms
- PMID: 20436456
- PMCID: PMC2892319
- DOI: 10.1038/embor.2010.50
The BH3-only Bnip3 binds to the dynamin Opa1 to promote mitochondrial fragmentation and apoptosis by distinct mechanisms
Abstract
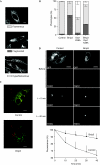
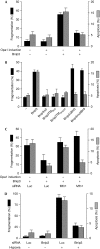
Opa1 modulates mitochondrial fusion, cristae structure and apoptosis. The relationships between these functions and autosomal dominant optic atrophy, caused by mutations in Opa1, are poorly defined. We show that Bnip3 interacts with Opa1, leading to mitochondrial fragmentation and apoptosis. Fission is due to inhibition of Opa1-mediated fusion and is counteracted by Opa1 in an Mfn1-dependent manner. Bnip3-Opa1 interaction is necessary to trigger Opa1 complex disruption in a Bax- and/or Bak-dependent manner, ultimately leading to apoptosis. Our results uncover a direct link between Opa1 on the inner mitochondrial membrane and the apoptotic machinery on the outer membrane that modulates fusion and cristae structure by separate mechanisms. These findings might help to unravel optic atrophy aetiology as retinal ganglion cells are particularly prone to hypoxia, an inductor of Bnip3 expression.
Conflict of interest statement
The authors declare that they have no conflict of interest.
Figures


Similar articles
-
OPA1 controls apoptotic cristae remodeling independently from mitochondrial fusion.Cell. 2006 Jul 14;126(1):177-89. doi: 10.1016/j.cell.2006.06.025. Cell. 2006. PMID: 16839885
-
Opa1-mediated cristae opening is Bax/Bak and BH3 dependent, required for apoptosis, and independent of Bak oligomerization.Mol Cell. 2008 Aug 22;31(4):557-569. doi: 10.1016/j.molcel.2008.07.010. Epub 2008 Aug 7. Mol Cell. 2008. PMID: 18691924 Free PMC article.
-
Appoptosin interacts with mitochondrial outer-membrane fusion proteins and regulates mitochondrial morphology.J Cell Sci. 2016 Mar 1;129(5):994-1002. doi: 10.1242/jcs.176792. Epub 2016 Jan 26. J Cell Sci. 2016. PMID: 26813789 Free PMC article.
-
The dynamin GTPase OPA1: more than mitochondria?Biochim Biophys Acta. 2013 Jan;1833(1):176-83. doi: 10.1016/j.bbamcr.2012.08.004. Epub 2012 Aug 11. Biochim Biophys Acta. 2013. PMID: 22902477 Review.
-
OPA1, a molecular regulator of dilated cardiomyopathy.J Cell Mol Med. 2023 Oct;27(20):3017-3025. doi: 10.1111/jcmm.17918. Epub 2023 Aug 21. J Cell Mol Med. 2023. PMID: 37603376 Free PMC article. Review.
Cited by
-
Differential Retinal Ganglion Cell Vulnerability, A Critical Clue for the Identification of Neuroprotective Genes in Glaucoma.Front Ophthalmol (Lausanne). 2022 May 31;2:905352. doi: 10.3389/fopht.2022.905352. eCollection 2022. Front Ophthalmol (Lausanne). 2022. PMID: 38983528 Free PMC article. Review.
-
Mitochondria and cell death: outer membrane permeabilization and beyond.Nat Rev Mol Cell Biol. 2010 Sep;11(9):621-32. doi: 10.1038/nrm2952. Epub 2010 Aug 4. Nat Rev Mol Cell Biol. 2010. PMID: 20683470 Review.
-
Inner-membrane proteins PMI/TMEM11 regulate mitochondrial morphogenesis independently of the DRP1/MFN fission/fusion pathways.EMBO Rep. 2011 Mar;12(3):223-30. doi: 10.1038/embor.2010.214. Epub 2011 Jan 28. EMBO Rep. 2011. PMID: 21274005 Free PMC article.
-
Apobec2 deficiency causes mitochondrial defects and mitophagy in skeletal muscle.FASEB J. 2018 Mar;32(3):1428-1439. doi: 10.1096/fj.201700493R. Epub 2018 Jan 3. FASEB J. 2018. PMID: 29127187 Free PMC article.
-
Molecular mechanisms of mitochondrial autophagy/mitophagy in the heart.Circ Res. 2015 Apr 10;116(8):1477-90. doi: 10.1161/CIRCRESAHA.116.303790. Circ Res. 2015. PMID: 25858070 Free PMC article. Review.
References
-
- Detmer SA, Chan DC (2007) Functions and dysfunctions of mitochondrial dynamics. Nat Rev Mol Cell Biol 8: 870–879 - PubMed
-
- Frezza C et al. (2006) OPA1 controls apoptotic cristae remodeling independently from mitochondrial fusion. Cell 126: 177–189 - PubMed
-
- Gurskaya NG, Verkhusha VV, Shcheglov AS, Staroverov DB, Chepurnykh TV, Fradkov AF, Lukyanov S, Lukyanov KA (2006) Engineering of a monomeric green-to-red photoactivatable fluorescent protein induced by blue light. Nat Biotechnol 24: 461–465 - PubMed
Publication types
MeSH terms
Substances
LinkOut - more resources
Full Text Sources
Other Literature Sources
Molecular Biology Databases
Research Materials

