. 2010 Apr 28;30(17):5979-91.
doi: 10.1523/JNEUROSCI.3962-09.2010.

Priming of hippocampal population bursts by individual perisomatic-targeting interneurons

Affiliations

Priming of hippocampal population bursts by individual perisomatic-targeting interneurons

Tommas J Ellender et al. J Neurosci. .

Abstract

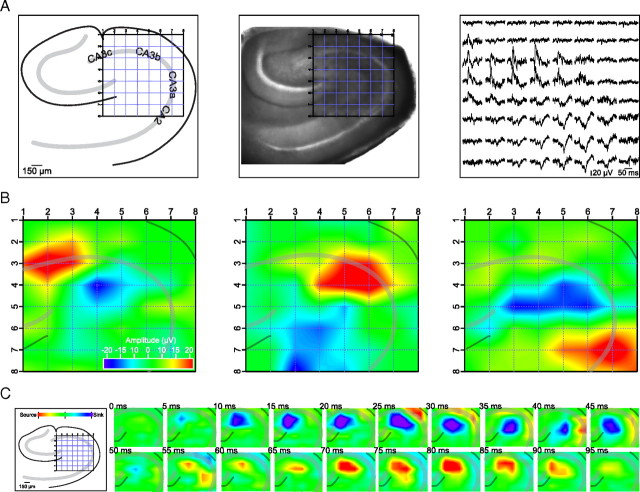
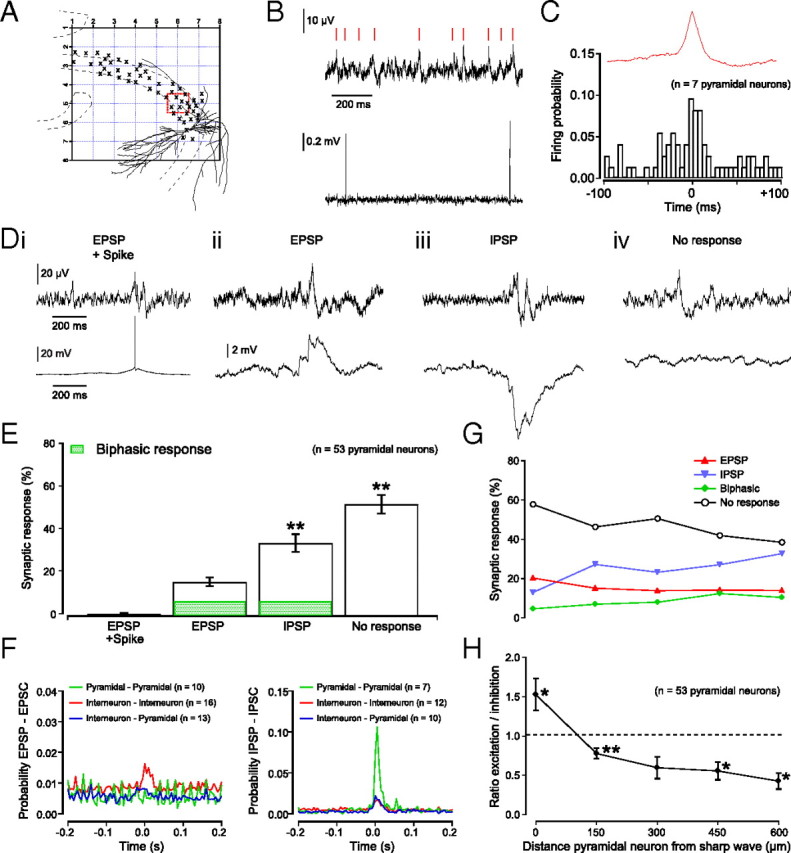
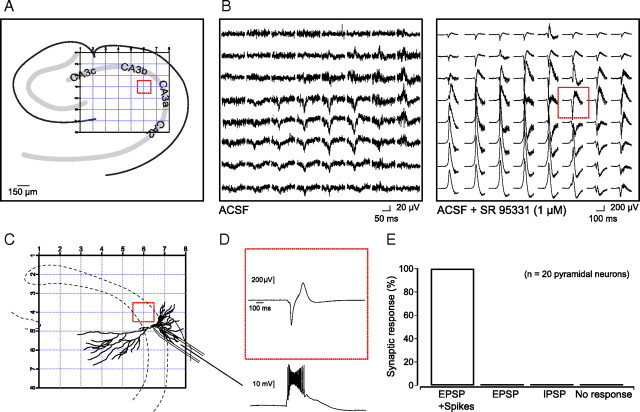
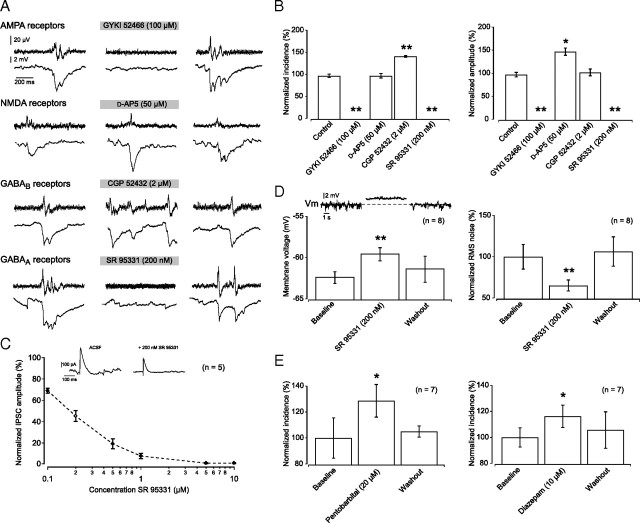
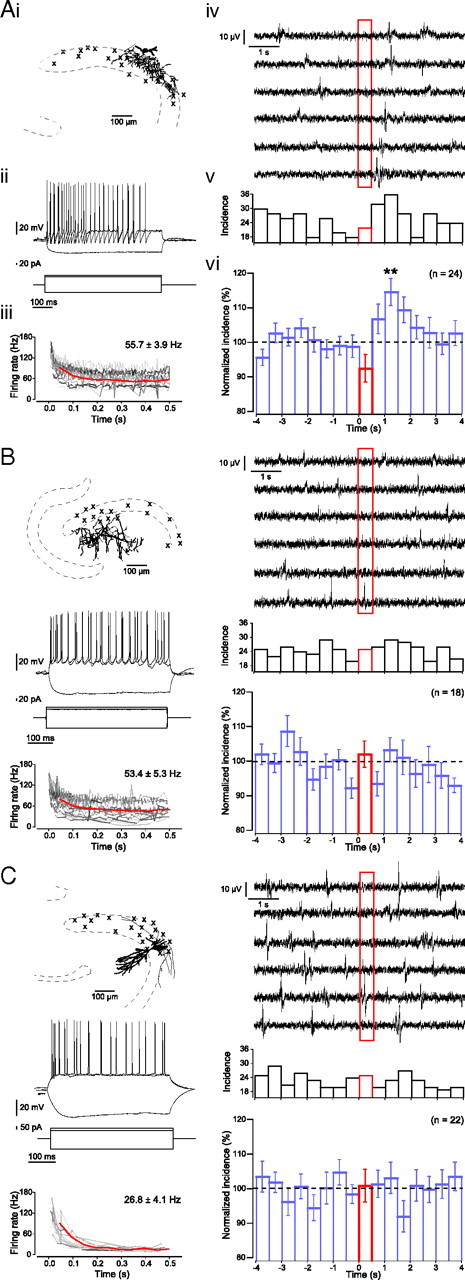
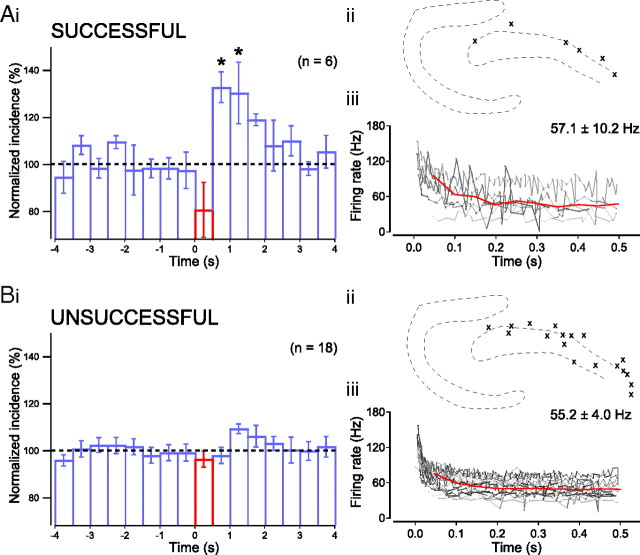
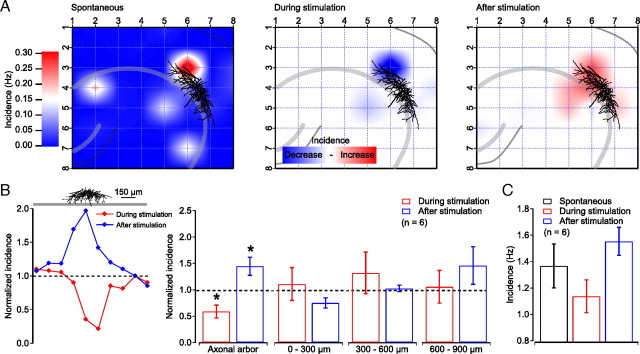
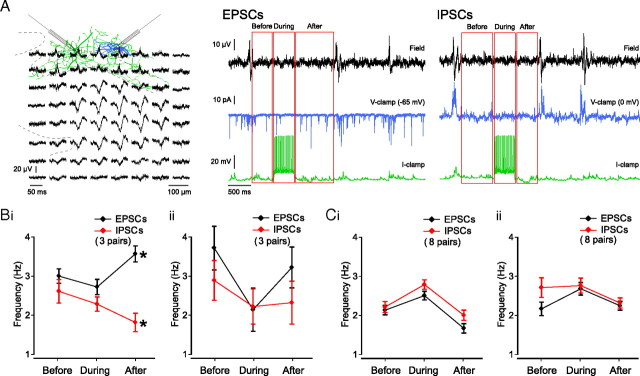
Hippocampal population bursts ("sharp wave-ripples") occur during rest and slow-wave sleep and are thought to be important for memory consolidation. The cellular mechanisms involved are incompletely understood. Here we investigated the cellular mechanisms underlying the initiation of sharp waves using a hippocampal slice model. To this end, we used a combination of field recordings with planar multielectrode arrays and whole-cell patch-clamp recordings of individual anatomically identified pyramidal neurons and interneurons. We found that GABA(A) receptor-mediated inhibition is necessary for sharp wave generation. Moreover, the activity of individual perisomatic-targeting interneurons can both suppress, and subsequently enhance, the local generation of sharp waves. Finally, we show that this is achieved by the tight control of local excitation and inhibition by perisomatic-targeting interneurons. These results suggest that perisomatic-targeting interneurons assist in selecting the subset of pyramidal neurons that initiate each hippocampal sharp wave-ripple.


Figures

Figure 1.
Figure 1.
Sharp wave-ripples in vitro. A, Schematic of a hippocampal slice showing the location of field recording electrodes in CA3 and CA1. Colored lines represent the locations at which axonal fibers were cut for experiments reported in C. B, Spontaneous network events were observed in hippocampal CA3 (left) and CA1 (right). These sharp waves (high pass filtered at 0.1 Hz; top), recorded in the pyramidal cell layer were superimposed by high-frequency oscillations (bandpass filtered between 80 and 250 Hz; middle), with both components apparent in the wavelet transform (normalized Morlet wavelet; ω0 = 6; warmer colors representing increasing magnitude; bottom). C, A cut between CA3 and CA1 abolished all sharp wave-ripple activity in CA1 without affecting those in CA3 (incidence: control, 1.56 ± 0.10 Hz; after cut, 1.60 ± 0.11 Hz; amplitude: control, 119 ± 17 μV; after cut, 92 ± 9 μV; independent-samples t test; p > 0.05; n = 14 slices). A cut between the dentate gyrus and CA3 did not alter the amplitude (control, 119 ± 17 μV; after cut, 113 ± 15 μV; independent-samples t test; p > 0.05; n = 12 slices) but significantly increased the incidence of sharp wave-ripples in CA3 (control, 1.56 ± 0.10 Hz; after cut, 1.91 ± 0.09 Hz; independent-samples t test; p < 0.05; n = 12 slices). Control refers to measurements made in 26 intact slices. These experiments were done in interface conditions.
Figure 2.
Figure 2.
Sharp waves can arise locally and independently in all CA3 subfields. A, Position of hippocampal slice on 8 × 8 planar multielectrode array, with schematic of the anatomy (left) and photograph of the slice (middle). A corresponding recording of a single sharp wave shows that the event is localized (right). B, Pseudocolor representation of the voltage deflections observed during three separate sharp waves in the same slice, with warm colors representing positive deflections and cooler colors negative deflections. Sharp waves could originate in all subfields of CA3 in a single slice. C, Current source density analysis of a single sharp wave in 5 ms frames. The event started as a sink in the stratum radiatum with a corresponding source in the pyramidal cell layer followed by a sink in the pyramidal cell layer with a corresponding source in the stratum radiatum.
Figure 3.
Figure 3.
Pyramidal neurons mostly receive inhibition during sharp waves. A, Schematic of an 8 × 8 planar multielectrode array with the location of a single pyramidal neuron as visualized with biocytin labeling. Locations of other patched pyramidal neuron somata are indicated with crosses. B, Trace with sharp waves as recorded from red boxed electrode in A (top) and spiking of pyramidal neuron recorded in cell-attached configuration (bottom). C, Plot of average firing probability for seven pyramidal neurons centered on the peak of a sharp wave. Mean firing rate of participating pyramidal neurons was 0.3 Hz. The remaining 86.8% of pyramidal neurons (46 of 53) were silent during all sharp wave events. D, Example traces of sharp waves (top) and whole-cell current-clamp recordings (bottom) demonstrating sharp wave-associated events. Pyramidal neurons could show spikes (i) or EPSPs (ii), but mostly showed IPSPs (iii) or did not respond (iv) during sharp waves. A small number of subthreshold events were biphasic, consisting of an EPSP–IPSP or IPSP–EPSP sequence. Single pyramidal neurons could exhibit all four types of responses during the period of a recording. E, Distribution of sharp wave-associated activity in pyramidal neurons (spikes, 0.2 ± 0.1%; EPSPs, 15.1 ± 2.0%; IPSPs, 34.4 ± 4.0% and no response, 50.4 ± 4.2%; ANOVA; p < 0.05; n = 53; pairwise comparisons (for comparisons, spikes and EPSPs were combined): IPSP vs spike and EPSP, p < 0.01. and No input vs spike and EPSP, p < 0.01, Student's t test). Of all subthreshold events, 9.1% were biphasic responses consisting of an EPSP–IPSP or IPSP–EPSP sequence. F, Cross-correlation probability plots of synchronous excitatory (left) and inhibitory (right) input between pairs of neurons. Note the largest correlation (0.11) for inhibitory inputs between pairs of pyramidal neurons. G, Distribution of sharp wave-associated activity in pyramidal neurons as a function of distance from sharp wave events. H, Frequency ratio of sharp waves with excitatory and inhibitory input to pyramidal neurons as a function of the distance from sharp wave events (ratio of excitation to inhibition, 1.5 ± 0.2, p < 0.05, n = 20; 0.8 ± 0.07, p < 0.01, n = 21; 0.6 ± 0.14, p > 0.05, n = 13; 0.6 ± 0.11, p < 0.05, n = 9; and 0.4 ± 0.10, p < 0.05, n = 17 at 0, 150, 300, 450, and 600 μm distances, respectively; one-sample t test).
Figure 4.
Figure 4.
Recurrent connectivity in CA3 is retained in 400 μm slice. A, Schematic of a hippocampal slice on an 8 × 8 planar multielectrode array. B, Blocking all GABAA receptor-mediated inhibition by application of SR95331 (1 μm) led to the generation of epileptiform bursts in area CA3. Shown is a recording of a sharp wave in ACSF (left) and an epileptiform burst in ACSF containing 1 μm SR95331 (right). Note the difference in both amplitude and duration of events. C, Schematic of an 8 × 8 planar multielectrode array with the location of a single pyramidal neuron as visualized with biocytin labeling. D, Trace of epileptiform activity as seen on a single electrode of the planar multielectrode array (red box) and multiple spike discharges of a patched pyramidal neuron. E, All pyramidal neurons (n = 20) took part in the epileptiform bursts, even those that received predominantly inhibitory or no input during sharp wave activity.
Figure 5.
Figure 5.
GABAA receptor-mediated inhibition is necessary for sharp wave generation. A, Simultaneous recording of sharp waves on planar multielectrode array with whole-cell current-clamp of pyramidal neuron. After 10 min of baseline recording, drugs acting on AMPA, NMDA, GABAB, or GABAA receptors were washed in, and their effect on both incidence and amplitude of ongoing sharp wave activity was assessed after 10 min. B, Effect of block of AMPA, NMDA, GABAB, or GABAA receptors on sharp wave amplitude and incidence, averaged over 6–12 slices. AMPA receptor antagonist GYKI52466 (100 μm) abolished all sharp wave activity. NMDA receptor antagonist d-AP5 (50 μm) significantly increased the amplitude of sharp waves with no effect on their incidence. GABAB receptor antagonist CGP52432 (2 μm) significantly and reversibly increased sharp wave incidence while not affecting amplitude. GABAA receptor antagonist SR95331 (200 nm) abolished all sharp wave activity. C, Dose-dependent reduction in IPSC amplitude by SR95331. Application of 200 nm SR95331 resulted in a 55 ± 5% reduction in IPSC amplitude. D, Application of SR95331 (200 nm) significantly depolarized pyramidal neurons and decreased the RMS noise outside of sharp wave events from 0.9 ± 0.1 to 0.5 ± 0.05 mV and back to 0.9 ± 0.2 mV upon washout (n = 8). Inset, Intracellular recording of pyramidal neuron in current-clamp mode. E, Enhancing GABAA receptor-mediated currents by application of pentobarbital (20 μm) or diazepam (10 μm) led to a significant and reversible increase in sharp wave incidence.
Figure 6.
Figure 6.
An individual perisomatic-targeting interneuron can suppress and subsequently enhance sharp wave incidence. A–C, The effects of single-cell firing on sharp wave generation was tested for anatomically identified perisomatic-targeting interneurons (A), dendritic-targeting interneurons (B), and pyramidal neurons (C). Each panel displays an example of each neuronal subtype with the soma location of all stimulated neurons indicated by crosses (i), two superposed responses to suprathreshold 500 ms current pulses as well as a single response to a hyperpolarizing current pulse (ii), a plot of spike rate during suprathreshold 500 ms current pulses for individual neurons (instantaneous frequency for individual neurons indicated by gray lines), and averaged over all neurons (red line; 50 ms bins) as well as the overall average spike rate indicated in the top right corner (iii), example traces of the effect of individual suprathreshold 500 ms current injection (stimulation between t = 0 s and 0.5 s; red box) on sharp wave events (iv), and the effect of this stimulation on sharp wave incidence for a single neuron (v) and averaged for a population of neurons (vi). Only stimulation of perisomatic-targeting interneurons produced a significant effect on network activity, with a local reduction in sharp wave incidence during stimulation and an increase in sharp wave incidence immediately and up to 1.5 s after stimulation.
Figure 7.
Figure 7.
Separation of successful and unsuccessful PTIs according to shuffling method. Plot of normalized incidence before, during, and after stimulation of successful PTIs (Ai; p < 0.05, ANOVA, n = 6; pairwise comparison: prestimulus baseline vs t = 0.5–1.0 s and t = 1.5–2.0 s, p < 0.05, post hoc Bonferroni) and unsuccessful PTIs (B). Location of somata of successful PTIs (Aii) and unsuccessful PTIs (Bii). Spiking of PTIs in response to a suprathreshold current step of 500 ms duration (instantaneous frequency for individual neurons indicated by gray lines) as well as averaged over all neurons (red line; 50 ms bins). There was no significant difference between the average spiking rate of successful PTIs (Aiii) and unsuccessful PTIs (Biii).
Figure 8.
Figure 8.
The suppression and postinhibitory enhancement of sharp wave generation is local to the axonal arborization of the stimulated perisomatic-targeting interneuron. A, Reconstruction of a single perisomatic-targeting interneuron and the spatial incidence of spontaneous sharp waves (left; baseline). There was a local decrease in sharp wave incidence during stimulation of the interneuron (middle), and a local postinhibitory enhancement after stimulation (right). Plotted is the difference between the incidence during and after stimulation relative to baseline. B, Left, Spatial distribution of sharp wave incidence ratio during (red) and following stimulation (blue) relative to baseline. This ratio is plotted relative to the axonal arbor of a perisomatic-targeting interneuron. Right, Plot of differential incidence during and after stimulation within the extent of the axonal arbor, and at 0–300, 300–600, and 600–900 μm distance from the outer limits of the axonal arbor. Over all cells, the change in sharp wave incidence during and after stimulation of perisomatic-targeting interneurons was significant only for the area of the axonal arborization (suppression, 0.59 ± 0.12, p < 0.05; enhancement, 1.4 ± 0.17, p < 0.05; one-sample t test, n = 6). C, There was no significant change in incidence during and after stimulation, as measured in the entire slice (p > 0.05; one-way ANOVA).
Figure 9.
Figure 9.
A single perisomatic-targeting interneuron can trigger a transient increase in excitation over inhibition. A, Schematic of two reconstructed interneurons and their location in hippocampal CA3. Simultaneous field recordings of ongoing sharp wave activity (top traces) combined with whole-cell current-clamp recording of a PTI (green cell and green traces) and whole-cell voltage-clamp recording of a DTI (blue cell and blue traces), held consecutively at −65 mV (for recording of EPSCs) and 0 mV (for recording of IPSCs). Red boxes indicate the three time periods used when estimating PSC frequencies. B, C, Frequency of EPSCs and IPSCs before, during, and after individual stimulation events in successful PTIs (B; EPSCs and IPSCs as recorded from one anatomically identified pyramidal neuron and two interneurons whose subtype could not be unequivocally determined) and unsuccessful PTIs (C; EPSCs and IPSCs as recorded from three anatomically identified pyramidal neurons, three anatomically identified DTIs and two interneurons whose subtype could not be unequivocally determined) (see Materials and Methods). Stimulation events were split into those that were followed by a sharp wave (within 1.5 s) (Bi, Ci) and those that were not (Bii, Cii).

Similar articles

Cited by

References

    1. Aradi I, Maccaferri G. Cell type-specific synaptic dynamics of synchronized bursting in the juvenile CA3 rat hippocampus. J Neurosci. 2004;24:9681–9692. - PMC - PubMed
    1. Banke TG, McBain CJ. GABAergic input onto CA3 hippocampal interneurons remains shunting throughout development. J Neurosci. 2006;26:11720–11725. - PMC - PubMed
    1. Battaglia FP, Sutherland GR, McNaughton BL. Hippocampal sharp wave bursts coincide with neocortical “up-state” transitions. Learn Mem. 2004;11:697–704. - PMC - PubMed
    1. Behrens CJ, van den Boom LP, de Hoz L, Friedman A, Heinemann U. Induction of sharp wave-ripple complexes in vitro and reorganization of hippocampal networks. Nat Neurosci. 2005;8:1560–1567. - PubMed
    1. Both M, Bähner F, von Bohlen und Halbach O, Draguhn A. Propagation of specific network patterns through the mouse hippocampus. Hippocampus. 2008;18:899–908. - PubMed

Publication types

Substances

LinkOut - more resources