Genome-wide MyoD binding in skeletal muscle cells: a potential for broad cellular reprogramming
- PMID: 20412780
- PMCID: PMC2910615
- DOI: 10.1016/j.devcel.2010.02.014
Genome-wide MyoD binding in skeletal muscle cells: a potential for broad cellular reprogramming
Abstract
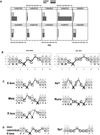
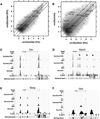
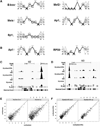
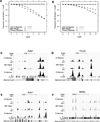
Recent studies have demonstrated that MyoD initiates a feed-forward regulation of skeletal muscle gene expression, predicting that MyoD binds directly to many genes expressed during differentiation. We have used chromatin immunoprecipitation and high-throughput sequencing to identify genome-wide binding of MyoD in several skeletal muscle cell types. As anticipated, MyoD preferentially binds to a VCASCTG sequence that resembles the in vitro-selected site for a MyoD:E-protein heterodimer, and MyoD binding increases during differentiation at many of the regulatory regions of genes expressed in skeletal muscle. Unanticipated findings were that MyoD was constitutively bound to thousands of additional sites in both myoblasts and myotubes, and that the genome-wide binding of MyoD was associated with regional histone acetylation. Therefore, in addition to regulating muscle gene expression, MyoD binds genome wide and has the ability to broadly alter the epigenome in myoblasts and myotubes.
Copyright 2010 Elsevier Inc. All rights reserved.
Figures
Comment in
-
MyoD, a lesson in widespread DNA binding.Dev Cell. 2010 Apr 20;18(4):505-6. doi: 10.1016/j.devcel.2010.04.004. Dev Cell. 2010. PMID: 20412764
Similar articles
-
Global and gene-specific analyses show distinct roles for Myod and Myog at a common set of promoters.EMBO J. 2006 Feb 8;25(3):502-11. doi: 10.1038/sj.emboj.7600958. Epub 2006 Jan 26. EMBO J. 2006. PMID: 16437161 Free PMC article.
-
Comparison of genome-wide binding of MyoD in normal human myogenic cells and rhabdomyosarcomas identifies regional and local suppression of promyogenic transcription factors.Mol Cell Biol. 2013 Feb;33(4):773-84. doi: 10.1128/MCB.00916-12. Epub 2012 Dec 10. Mol Cell Biol. 2013. PMID: 23230269 Free PMC article.
-
Genome-wide analysis of chromatin structure changes upon MyoD binding in proliferative myoblasts during the cell cycle.J Biochem. 2021 Sep 7;169(6):653-661. doi: 10.1093/jb/mvab001. J Biochem. 2021. PMID: 33479729
-
Skeletal muscle programming and re-programming.Curr Opin Genet Dev. 2013 Oct;23(5):568-73. doi: 10.1016/j.gde.2013.05.002. Epub 2013 Jun 4. Curr Opin Genet Dev. 2013. PMID: 23756045 Free PMC article. Review.
-
The circuitry of a master switch: Myod and the regulation of skeletal muscle gene transcription.Development. 2005 Jun;132(12):2685-95. doi: 10.1242/dev.01874. Development. 2005. PMID: 15930108 Review.
Cited by
-
Combination of cell signaling molecules can facilitate MYOD1-mediated myogenic transdifferentiation of pig fibroblasts.J Anim Sci Biotechnol. 2021 May 13;12(1):64. doi: 10.1186/s40104-021-00583-1. J Anim Sci Biotechnol. 2021. PMID: 33980301 Free PMC article.
-
Validation of skeletal muscle cis-regulatory module predictions reveals nucleotide composition bias in functional enhancers.PLoS Comput Biol. 2011 Dec;7(12):e1002256. doi: 10.1371/journal.pcbi.1002256. Epub 2011 Dec 1. PLoS Comput Biol. 2011. PMID: 22144875 Free PMC article.
-
A systems approach and skeletal myogenesis.Comp Funct Genomics. 2012;2012:759407. doi: 10.1155/2012/759407. Epub 2012 Sep 6. Comp Funct Genomics. 2012. PMID: 22991503 Free PMC article.
-
The Hippo pathway member Yap plays a key role in influencing fate decisions in muscle satellite cells.J Cell Sci. 2012 Dec 15;125(Pt 24):6009-19. doi: 10.1242/jcs.109546. Epub 2012 Oct 4. J Cell Sci. 2012. PMID: 23038772 Free PMC article.
-
Regulation of active and quiescent somatic stem cells by Notch signaling.Dev Growth Differ. 2020 Jan;62(1):59-66. doi: 10.1111/dgd.12626. Epub 2019 Sep 6. Dev Growth Differ. 2020. PMID: 31489617 Free PMC article. Review.
References
-
- Andreucci JJ, Grant D, Cox DM, Tomc LK, Prywes R, Goldhamer DJ, Rodrigues N, Bedard PA, McDermott JC. Composition and function of AP-1 transcription complexes during muscle cell differentiation. J Biol Chem. 2002;277:16426–16432. - PubMed
-
- Aoki K, Meng G, Suzuki K, Takashi T, Kameoka Y, Nakahara K, Ishida R, Kasai M. RP58 associates with condensed chromatin and mediates a sequence-specific transcriptional repression. J Biol Chem. 1998;273:26698–26704. - PubMed
-
- Asakura A, Lyons GE, Tapscott SJ. The regulation of MyoD gene expression: conserved elements mediate expression in embryonic axial muscle. Dev Biol. 1995;171:386–398. - PubMed
-
- Benezra R, Davis RL, Lockshon D, Turner DL, Weintraub H. The protein Id: a negative regulator of helix-loop-helix DNA binding proteins. Cell. 1990;61:49–59. - PubMed
-
- Bergstrom DA, Penn BH, Strand A, Perry RL, Rudnicki MA, Tapscott SJ. Promoter-specific regulation of MyoD binding and signal transduction cooperate to pattern gene expression. Mol Cell. 2002;9:587–600. - PubMed
Publication types
MeSH terms
Substances
Associated data
- Actions
Grants and funding
LinkOut - more resources
Full Text Sources
Other Literature Sources
Molecular Biology Databases
Research Materials

