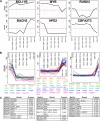
Gene enrichment profiles reveal T-cell development, differentiation, and lineage-specific transcription factors including ZBTB25 as a novel NF-AT repressor
- PMID: 20410506
- PMCID: PMC2902135
- DOI: 10.1182/blood-2010-01-263855
Gene enrichment profiles reveal T-cell development, differentiation, and lineage-specific transcription factors including ZBTB25 as a novel NF-AT repressor
Abstract
The identification of transcriptional regulatory networks, which control tissue-specific development and function, is of central importance to the understanding of lymphocyte biology. To decipher transcriptional networks in T-cell development and differentiation we developed a browsable expression atlas and applied a novel quantitative method to define gene sets most specific to each of the represented cell subsets and tissues. Using this system, body atlas size datasets can be used to examine gene enrichment profiles from a cell/tissue perspective rather than gene perspective, thereby identifying highly enriched genes within a cell type, which are often key to cellular differentiation and function. A systems analysis of transcriptional regulators within T cells during different phases of development and differentiation resulted in the identification of known key regulators and uncharacterized coexpressed regulators. ZBTB25, a BTB-POZ family transcription factor, was identified as a highly T cell-enriched transcription factor. We provide evidence that ZBTB25 functions as a negative regulator of nuclear factor of activated T cells (NF-AT) activation, such that RNA interference mediated knockdown resulted in enhanced activation of target genes. Together, these findings suggest a novel mechanism for NF-AT mediated gene expression and the compendium of expression data provides a quantitative platform to drive exploration of gene expression across a wide range of cell/tissue types.
Figures


Similar articles
-
Zinc Finger-Containing Cellular Transcription Corepressor ZBTB25 Promotes Influenza Virus RNA Transcription and Is a Target for Zinc Ejector Drugs.J Virol. 2017 Sep 27;91(20):e00842-17. doi: 10.1128/JVI.00842-17. Print 2017 Oct 15. J Virol. 2017. PMID: 28768860 Free PMC article.
-
BRG1-mediated chromatin remodeling regulates differentiation and gene expression of T helper cells.Mol Cell Biol. 2008 Dec;28(24):7274-85. doi: 10.1128/MCB.00835-08. Epub 2008 Oct 13. Mol Cell Biol. 2008. PMID: 18852284 Free PMC article.
-
Reconstitution of T cell-specific transcription directed by composite NFAT/Oct elements.J Immunol. 2000 Nov 15;165(10):5646-55. doi: 10.4049/jimmunol.165.10.5646. J Immunol. 2000. PMID: 11067921
-
Transcription: tantalizing times for T cells.Cell. 2002 Apr;109 Suppl:S109-20. doi: 10.1016/s0092-8674(02)00705-5. Cell. 2002. PMID: 11983157 Review.
-
The role of NF-AT transcription factors in T cell activation and differentiation.Biochim Biophys Acta. 2000 Oct 20;1498(1):1-18. doi: 10.1016/s0167-4889(00)00082-3. Biochim Biophys Acta. 2000. PMID: 11042346 Review.
Cited by
-
Systematic prioritization and integrative analysis of copy number variations in schizophrenia reveal key schizophrenia susceptibility genes.Schizophr Bull. 2014 Nov;40(6):1285-99. doi: 10.1093/schbul/sbu045. Epub 2014 Mar 24. Schizophr Bull. 2014. PMID: 24664977 Free PMC article.
-
Identification of CD112R as a novel checkpoint for human T cells.J Exp Med. 2016 Feb 8;213(2):167-76. doi: 10.1084/jem.20150785. Epub 2016 Jan 11. J Exp Med. 2016. PMID: 26755705 Free PMC article.
-
Novel multivariate methods for integration of genomics and proteomics data: applications in a kidney transplant rejection study.OMICS. 2014 Nov;18(11):682-95. doi: 10.1089/omi.2014.0062. OMICS. 2014. PMID: 25387159 Free PMC article.
-
Network Analysis of Genome-Wide Selective Constraint Reveals a Gene Network Active in Early Fetal Brain Intolerant of Mutation.PLoS Genet. 2016 Jun 15;12(6):e1006121. doi: 10.1371/journal.pgen.1006121. eCollection 2016 Jun. PLoS Genet. 2016. PMID: 27305007 Free PMC article.
-
Genetic variants affecting the neural processing of human facial expressions: evidence using a genome-wide functional imaging approach.Transl Psychiatry. 2012 Jul 24;2(7):e143. doi: 10.1038/tp.2012.67. Transl Psychiatry. 2012. PMID: 22828495 Free PMC article.
References
-
- Anderson MK, Hernandez-Hoyos G, Diamond RA, Rothenberg EV. Precise developmental regulation of Ets family transcription factors during specification and commitment to the T cell lineage. Development. 1999;126(14):3131–3148. - PubMed
Publication types
MeSH terms
Substances
Grants and funding
LinkOut - more resources
Full Text Sources
Other Literature Sources
Molecular Biology Databases

