

Classification and quantification of leaf curvature
- PMID: 20400533
- PMCID: PMC2882270
- DOI: 10.1093/jxb/erq111
Classification and quantification of leaf curvature
Abstract
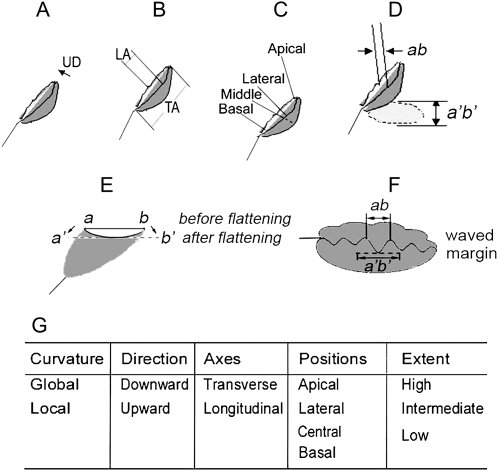
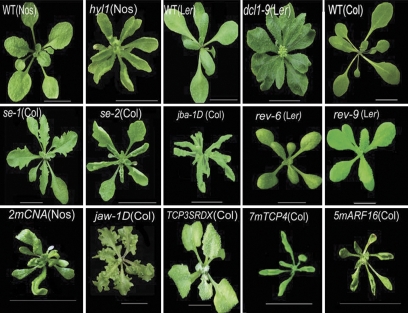
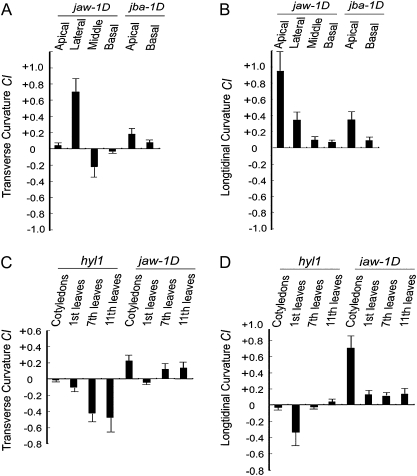
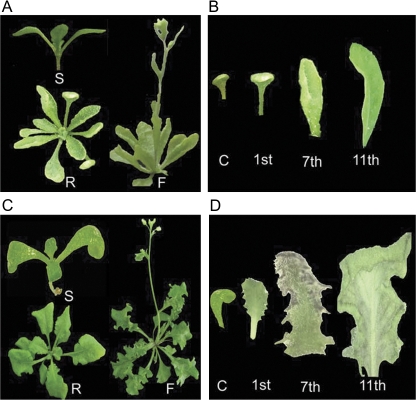
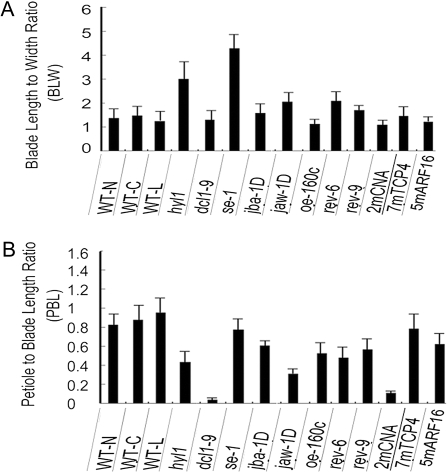
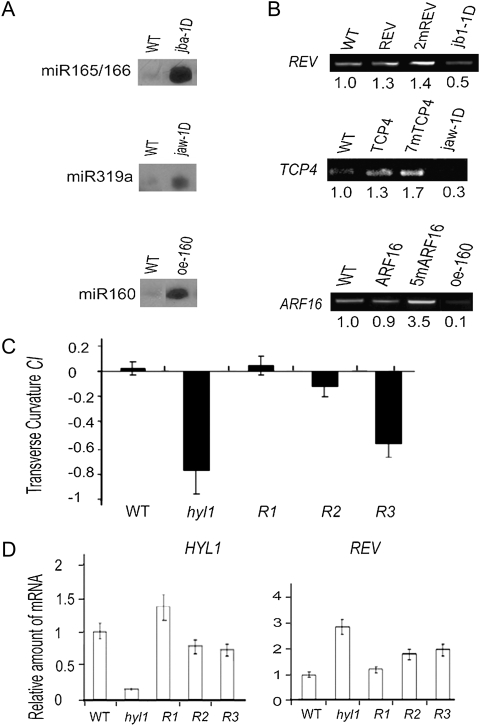
Various mutants of Arabidopsis thaliana deficient in polarity, cell division, and auxin response are characterized by certain types of leaf curvature. However, comparison of curvature for clarification of gene function can be difficult without a quantitative measurement of curvature. Here, a novel method for classification and quantification of leaf curvature is reported. Twenty-two mutant alleles from Arabidopsis mutants and transgenic lines deficient in leaf flatness were selected. The mutants were classified according to the direction, axis, position, and extent of leaf curvature. Based on a global measure of whole leaves and a local measure of four regions in the leaves, the curvature index (CI) was proposed to quantify the leaf curvature. The CI values accounted for the direction, axis, position, and extent of leaf curvature in all of the Arabidopsis mutants grown in growth chambers. Comparison of CI values between mutants reveals the spatial and temporal variations of leaf curvature, indicating the strength of the mutant alleles and the activities of the corresponding genes. Using the curvature indices, the extent of curvature in a complicated genetic background becomes quantitative and comparable, thus providing a useful tool for defining the genetic components of leaf development and to breed new varieties with leaf curvature desirable for the efficient capture of sunlight for photosynthesis and high yields.
Figures

Similar articles
-
The tarani mutation alters surface curvature in Arabidopsis leaves by perturbing the patterns of surface expansion and cell division.J Exp Bot. 2015 Apr;66(7):2107-22. doi: 10.1093/jxb/erv015. Epub 2015 Feb 24. J Exp Bot. 2015. PMID: 25711708 Free PMC article.
-
HYL1 regulates the balance between adaxial and abaxial identity for leaf flattening via miRNA-mediated pathways.J Exp Bot. 2011 Aug;62(12):4367-81. doi: 10.1093/jxb/err167. Epub 2011 May 24. J Exp Bot. 2011. PMID: 21610018 Free PMC article.
-
Quantitative phenotyping of leaf margins in three dimensions, demonstrated on KNOTTED and TCP trangenics in Arabidopsis.J Exp Bot. 2014 May;65(8):2071-7. doi: 10.1093/jxb/eru062. Epub 2014 Apr 4. J Exp Bot. 2014. PMID: 24706720 Free PMC article.
-
Morphogenesis of simple leaves: regulation of leaf size and shape.Wiley Interdiscip Rev Dev Biol. 2014 Jan-Feb;3(1):41-57. doi: 10.1002/wdev.115. Epub 2013 Apr 18. Wiley Interdiscip Rev Dev Biol. 2014. PMID: 24902833 Review.
-
Leaf development: a cellular perspective.Front Plant Sci. 2014 Jul 31;5:362. doi: 10.3389/fpls.2014.00362. eCollection 2014. Front Plant Sci. 2014. PMID: 25132838 Free PMC article. Review.
Cited by
-
Identification of conserved and novel microRNAs that are responsive to heat stress in Brassica rapa.J Exp Bot. 2012 Jan;63(2):1025-38. doi: 10.1093/jxb/err337. Epub 2011 Oct 24. J Exp Bot. 2012. PMID: 22025521 Free PMC article.
-
Identification of YUC genes associated with leaf wrinkling trait in Tacai variety of Chinese cabbage.PeerJ. 2024 May 20;12:e17337. doi: 10.7717/peerj.17337. eCollection 2024. PeerJ. 2024. PMID: 38784401 Free PMC article.
-
Overexpression of LtKNOX1 from Lilium tsingtauense in Nicotiana benthamiana affects the development of leaf morphology.Plant Signal Behav. 2022 Dec 31;17(1):2031783. doi: 10.1080/15592324.2022.2031783. Epub 2022 Feb 10. Plant Signal Behav. 2022. PMID: 35139775 Free PMC article.
-
Conjunctive Analyses of BSA-Seq and BSR-Seq to Reveal the Molecular Pathway of Leafy Head Formation in Chinese Cabbage.Plants (Basel). 2019 Dec 13;8(12):603. doi: 10.3390/plants8120603. Plants (Basel). 2019. PMID: 31847231 Free PMC article.
-
Cytoplasmic HYL1 modulates miRNA-mediated translational repression.Plant Cell. 2021 Jul 19;33(6):1980-1996. doi: 10.1093/plcell/koab090. Plant Cell. 2021. PMID: 33764452 Free PMC article.
References
-
- Byrne ME, Barley R, Curtis M, Arroyo JM, Dunham M, Hudson H, Martienssen RA. Asymmetric leaves1 mediates leaf patterning and stem cell function in Arabidopsis. Nature. 2000;408:967–971. - PubMed
-
- Donnelly PM, Bonetta D, Tsukaya H, Dengler RE, Dengler NG. Cell cycling and cell enlargement in developing leaves of Arabidopsis. Developmental Biology. 1999;215:407–419. - PubMed
