. 2010 Apr 30;141(3):419-31.
doi: 10.1016/j.cell.2010.03.010. Epub 2010 Apr 15.

The in vivo pattern of binding of RAG1 and RAG2 to antigen receptor loci

Affiliations

The in vivo pattern of binding of RAG1 and RAG2 to antigen receptor loci

Yanhong Ji et al. Cell. .

Erratum in

  • Cell. 2010 Oct 1;143(1):170

Abstract

The critical initial step in V(D)J recombination, binding of RAG1 and RAG2 to recombination signal sequences flanking antigen receptor V, D, and J gene segments, has not previously been characterized in vivo. Here, we demonstrate that RAG protein binding occurs in a highly focal manner to a small region of active chromatin encompassing Ig kappa and Tcr alpha J gene segments and Igh and Tcr beta J and J-proximal D gene segments. Formation of these small RAG-bound regions, which we refer to as recombination centers, occurs in a developmental stage- and lineage-specific manner. Each RAG protein is independently capable of specific binding within recombination centers. While RAG1 binding was detected only at regions containing recombination signal sequences, RAG2 binds at thousands of sites in the genome containing histone 3 trimethylated at lysine 4. We propose that recombination centers coordinate V(D)J recombination by providing discrete sites within which gene segments are captured for recombination.


Figures

Figure 1
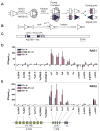
Figure 1. RAG binding to the Igκ locus in pre-B cells
(A) Steps in V(D)J recombination. RAG1-RAG2-HMGB1/2 complex is represented as a gray oval, RSSs as triangles, and coding segments as rectangles. (B) DNA cleavage by the RAG proteins. (C) The D708A BAC. RAG1 and RAG2 exons are represented as black boxes and the direction of transcription is indicated with arrows. The RAG2 locus expresses green fluorescence protein (GFP) instead of RAG2. A mutation introduced into Rag1 (asterisk) changes the codon for Asp708 to an alanine codon. (D-E) Binding of RAG1 (D) or RAG2 (E) was assessed by ChIP in primary CD19+ bone marrow B-lineage cells from Rag1−/− B1-8i Igh knockin (R1−/−H), D708A transgene-positive Rag1−/− B1-8i Igh knockin (D708A-R1−/−H), and Rag2−/− B1-8i Igh knockin (R2−/−H) mice. DNA recovery in immunoprecipitates was measured by qPCR using primers that detect four individual Vκ gene segments, four closely related Vκ gene segments (Vκ220), a group of about 40 Vκ gene segments (Vκ(degen)) (Curry et al., 2005), the four individual functional Jκ gene segments, the constant region exon (Cκ), and four non-antigen receptor genes as indicated below each graph and in the schematic diagram of the Igκ locus at the bottom of the figure. The diagram indicates only the relative locations of the various Igκ gene segments and is not drawn to scale. IP/Inputcorr values have been corrected for background and normalized to the input signal as described in Experimental Procedures, with bars indicating the mean of three independent experiments and error bars representing the SEM. See also Figs. S1–S4.
Figure 2
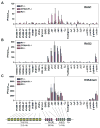
Figure 2. RAG binding to the Igh and Igκ loci in pro-B cells
(A-C) Binding of RAG1 (A), RAG2 (B), or levels of H3K4me3 (C) were assessed by ChIP in primary CD19+ bone marrow B-lineage cells from Rag1−/− (R1−/−), D708A transgene-positive Rag1−/− (D708A-R1−/−), and Rag2−/− (R2−/−) mice at the gene segments or regions indicated. Data are the average of 2 independent experiments and are presented as in Fig. 1. Cμ, Igμ constant region. See also Figs. S1, S3, and S5.
Figure 3
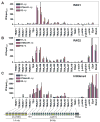
Figure 3. RAG binding to the Tcrα locus in pre-T cells
(A-C) Binding of RAG1 (A), RAG2 (B), or levels of H3K4me3 (C) were assessed by ChIP in primary thymocytes from Rag1−/− 2B4 Tcrβ transgenic (R1−/−β), D708A transgene-positive Rag1−/− 2B4 Tcrβ transgenic (D708A-R1−/−β), and Rag2−/− 2B4 Tcrβ transgenic (R2−/−β) mice at the gene segments or regions indicated. Data are presented as in Fig. 1 and are the average of three (RAG1 and H3K4me3) or four (RAG2) independent experiments except for TRAJ56 and TRAJ53, which were analyzed twice for RAG1 and RAG2. ND, not done; TRAC, Tcrα constant region; TEA, TEA promoter. See also Figs. S1 and S3.
Figure 4
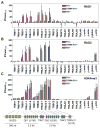
Figure 4. RAG binding to the Tcrβ and Tcrα loci in pro-T cells
(A-C) Binding of RAG1 (A), RAG2 (B), or levels of H3K4me3 (C) were assessed by ChIP in primary thymocytes from Rag1−/− (R1−/−), D708A transgene-positive Rag1−/− (D708A-R1−/−), and Rag2−/− (R2−/−) mice at the gene segments or regions indicated. Data are the average of three (RAG1) or two (RAG2 and H3K4me3) independent experiments and are presented as in Fig. 1. TRBC1 and TRBC2, Tcrβ constant regions 1 and 2; TRBD1 (Dβ1) and TRBD2 (Dβ2), red rectangles. See also Figs. S1, S3, and S5.
Figure 5
Figure 5. The RSS and nonamer binding domain are important for RAG binding
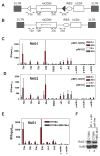
(A and B) The pINV-12/23 (A) and pINV-0 (B) recombination substrates. The 5′ and 3′ long terminal repeats (LTR), mouse CD90 gene (mCD90) encoding Thy1.1, and human CD4 gene (hCD4) are indicated as rectangles, the internal ribosome entry site (IRES) as an oval, and the 12RSS and 23RSS as white and black triangles, respectively. The mCD90 gene lies in opposite transcriptional orientation (long arrow) to that of transcription originating in the 5′LTR. The positions of PCR primers are indicated with short arrows. Primer pairs 12a and 23d span the 12RSS and 23RSS respectively in pINV-12/23, and generate 109 bp (12a) and 61 bp (23d) smaller products with pINV-0 than with pINV-12/23 due to deletion of the RSSs. Primer pairs 12b and 23c lie 69 bp 3′ of the 12RSS and 91 bp 5′ the 23RSS, respectively. Not drawn to scale. (C-D) Binding of RAG1 (C) or RAG2 (D) were assessed by ChIP in the D345 v-abl transformed cell line infected with pINV-12/23 (gray and red bars) or pINV-0 (white and blue bars) either prior to RAG induction (0hr) or after 20 hours of RAG induction (20hr) at the gene segments or regions indicated. Data are the average of two independent experiments and are presented as in Fig. 1. See also Fig. S6. (E) Binding of RAG1 was assessed in a R1−/− cell line containing pINV-12/23 and infected with a retrovirus expressing D708A RAG1 (red bars) or nonamer binding domain (NBD) mutant D708A RAG1 (blue bars) and a linked blastocydin resistance gene. Data were collected from blastocydin-resistant clones 20 hours after treatment with STI-571 and are the average of two independent experiments. Similar data were obtained using a second set of independently derived clones (data not shown). (F) Western blot of D708A RAG1 and NBD-mutant D708A RAG1 proteins in infected R1−/− v-abl cells. A separate blot of the same protein extracts was probed for Ku80 to confirm equal loading.
Figure 6
Figure 6. ChIP-seq analysis of RAG2 binding in thymocytes
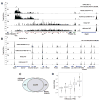
(A and B) The number of sequence tags per million mapped tags is plotted in 100 bp windows across a region spanning the Jα gene segments (A) or a gene rich region on chromosome 14 (B). Immunoprecipitations were performed with anti-RAG2 (panels i, ii, and iv) or anti-H3K4me3 (panels iii and v) antibodies using total thymocytes from Rag2−/− 2B4 Tcrβ transgenic (R2−/−β) (panel i), D708A transgene-positive Rag1−/− 2B4 Tcrβ transgenic (D708A-R1−/−β) (panels ii and iii), or WT (panels iv and v) mice. The locations of genes and gene segments are indicated below the X-axes, with the direction of transcription indicated with arrowheads. Eα, Tcrα enhancer; TRDC, Tcrδ constant region. (C) Venn diagram showing spatial overlap between RAG2 and H3K4me3 islands using ChIP-seq data pooled from WT and D708A-R1−/−β thymocytes. (D) Combined H3K4me3 islands were separated into 4 groups of equal size (Low, Q2, Q3, High) according to the numbers of reads mapped to the island in the H3K4me3 Chip-Seq experiment; a fifth group of RAG2 islands lacking H3K4me3 reads was also defined (none). The numbers of reads in tags per million aligned reads (tpm) for these five groups in the Rag2 Chip-Seq is shown for each of the groups as a box and whisker plot on a logarithmic scale. See also Fig. S7 and Table S2.
Figure 7
Figure 7. Recombination center model for V(D)J recombination
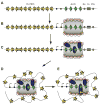
(A) Schematic depiction of the Igκ locus showing V and J gene segments (yellow and green rectangles, respectively), 12RSSs and 23RSSs (yellow and green triangles, respectively), germline promoters (black circles), the intronic (iEκ) and 3′ (3′Eκ) enhancers (gray circles) and the constant region (gray rectangle). (B) Germline promoters and enhancers cooperate to create a domain (gray shaded area) with high levels of germline transcription (arrows) and activating histone modifications including histone acetylation (Ac) and H3K4me3 (me) encompassing the Jκ gene segments. (C) The RAG proteins (blue ovals) are recruited into this domain by virtue of direct RAG-RSS interactions and binding of the PHD domain of RAG2 to H3K4me3, forming the recombination center. No attempt is made to distinguish between the RAG1-RAG2 complex and the individual RAG proteins. (D) Large scale reorganization of the chromatin fiber brings V gene segments into close proximity of the recombination center, where they compete for capture by the RAG proteins in the recombination center. (E) One V gene segment is stably captured in the recombination center in a synaptic complex (large blue oval) containing RAG1, RAG2, the Vκ and Jκ RSSs, and probably HMGB1/2. Within this complex, the RAG proteins introduce double strand breaks between the gene segments and their flanking RSSs (not shown), completing the first phase of V(D)J recombination.

Comment in

Similar articles

Cited by

References

    1. Barski A, Cuddapah S, Cui K, Roh TY, Schones DE, Wang Z, Wei G, Chepelev I, Zhao K. High-resolution profiling of histone methylations in the human genome. Cell. 2007;129:823–837. - PubMed
    1. Bassing CH, Whitlow S, Mostoslovasky R, Yang-Iott K, Ranganath S, Alt FW. Vbeta cluster sequences reduce the frequency of primary Vbeta2 and Vbeta14 rearrangements. Eur J Immunol. 2008;38:2564–2572. - PMC - PubMed
    1. Berg LJ, Pullen AM, Fazekas de St Groth B, Mathis D, Benoist C, Davis MM. Antigen/MHC-specific T cells are preferentially exported from the thymus in the presence of their MHC ligand. Cell. 1989;58:1035–1046. - PubMed
    1. Bredemeyer AL, Sharma GG, Huang CY, Helmink BA, Walker LM, Khor KC, Nuskey B, Sullivan KE, Pandita TK, Bassing CH, et al. ATM stabilizes DNA double-strand-break complexes during V(D)J recombination. Nature. 2006;442:466–470. - PubMed
    1. Chakraborty T, Chowdhury D, Keyes A, Jani A, Subrahmanyam R, Ivanova I, Sen R. Repeat organization and epigenetic regulation of the D-H-C-mu domain of the immunoglobulin heavy-chain gene locus. Mol Cell. 2007;27:842–850. - PubMed

Publication types

Associated data