

JISTIC: identification of significant targets in cancer
- PMID: 20398270
- PMCID: PMC2873534
- DOI: 10.1186/1471-2105-11-189
JISTIC: identification of significant targets in cancer
Abstract
Background: Cancer is caused through a multistep process, in which a succession of genetic changes, each conferring a competitive advantage for growth and proliferation, leads to the progressive conversion of normal human cells into malignant cancer cells. Interrogation of cancer genomes holds the promise of understanding this process, thus revolutionizing cancer research and treatment. As datasets measuring copy number aberrations in tumors accumulate, a major challenge has become to distinguish between those mutations that drive the cancer versus those passenger mutations that have no effect.
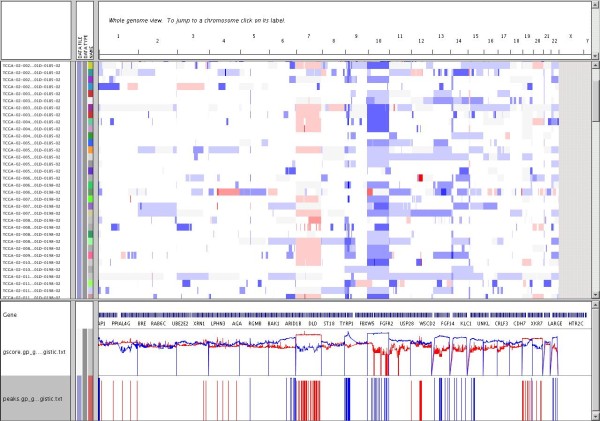
Results: We present JISTIC, a tool for analyzing datasets of genome-wide copy number variation to identify driver aberrations in cancer. JISTIC is an improvement over the widely used GISTIC algorithm. We compared the performance of JISTIC versus GISTIC on a dataset of glioblastoma copy number variation, JISTIC finds 173 significant regions, whereas GISTIC only finds 103 significant regions. Importantly, the additional regions detected by JISTIC are enriched for oncogenes and genes involved in cell-cycle and proliferation.
Conclusions: JISTIC is an easy-to-install platform independent implementation of GISTIC that outperforms the original algorithm detecting more relevant candidate genes and regions. The software and documentation are freely available and can be found at: http://www.c2b2.columbia.edu/danapeerlab/html/software.html.
Figures
Similar articles
-
Genome-wide identification of significant aberrations in cancer genome.BMC Genomics. 2012 Jul 27;13:342. doi: 10.1186/1471-2164-13-342. BMC Genomics. 2012. PMID: 22839576 Free PMC article.
-
MIRAGAA--a methodology for finding coordinated effects of microRNA expression changes and genome aberrations in cancer.Bioinformatics. 2010 Jan 15;26(2):161-7. doi: 10.1093/bioinformatics/btp654. Epub 2009 Nov 23. Bioinformatics. 2010. PMID: 19933823
-
Assessing the significance of conserved genomic aberrations using high resolution genomic microarrays.PLoS Genet. 2007 Aug;3(8):e143. doi: 10.1371/journal.pgen.0030143. PLoS Genet. 2007. PMID: 17722985 Free PMC article.
-
[Exploration of novel molecular targets for cancer therapy based on genomic aberrations].Gan To Kagaku Ryoho. 2005 Nov;32(12):1891-4. Gan To Kagaku Ryoho. 2005. PMID: 16282722 Review. Japanese.
-
Bioinformatics and cancer: an essential alliance.Clin Transl Oncol. 2006 Jun;8(6):409-15. doi: 10.1007/s12094-006-0194-6. Clin Transl Oncol. 2006. PMID: 16790393 Review.
Cited by
-
Germline and somatic variations influence the somatic mutational signatures of esophageal squamous cell carcinomas in a Chinese population.BMC Genomics. 2018 Jul 16;19(1):538. doi: 10.1186/s12864-018-4906-4. BMC Genomics. 2018. PMID: 30012096 Free PMC article.
-
Detecting independent and recurrent copy number aberrations using interval graphs.Bioinformatics. 2014 Jun 15;30(12):i195-203. doi: 10.1093/bioinformatics/btu276. Bioinformatics. 2014. PMID: 24931984 Free PMC article.
-
Transposon mutagenesis identifies genetic drivers of Braf(V600E) melanoma.Nat Genet. 2015 May;47(5):486-95. doi: 10.1038/ng.3275. Epub 2015 Apr 13. Nat Genet. 2015. PMID: 25848750 Free PMC article.
-
A high-throughput computational framework for identifying significant copy number aberrations from array comparative genomic hybridisation data.Adv Bioinformatics. 2012;2012:876976. doi: 10.1155/2012/876976. Epub 2012 Sep 13. Adv Bioinformatics. 2012. PMID: 23008709 Free PMC article.
-
The landscape of candidate driver genes differs between male and female breast cancer.PLoS One. 2013 Oct 23;8(10):e78299. doi: 10.1371/journal.pone.0078299. eCollection 2013. PLoS One. 2013. PMID: 24194916 Free PMC article.
References
-
- Beroukhim R, Getz G, Nghiemphu L, Barretina J, Hsueh T, Linhart D, Vivanco I, Lee JC, Huang JH, Alexander S. Assessing the significance of chromosomal aberrations in cancer: methodology and application to glioma. Proc Natl Acad Sci USA. 2007;104(50):20007–20012. doi: 10.1073/pnas.0710052104. - DOI - PMC - PubMed
-
- Pollack JR, Sørlie T, Perou CM, Rees CA, Jeffrey SS, Lonning PE, Tibshirani R, Botstein D, Børresen-Dale A-L, Brown PO. Microarray analysis reveals a major direct role of DNA copy number alteration in the transcriptional program of human breast tumors. Proceedings of the National Academy of Sciences of the United States of America. 2002;99(20):12963–12968. doi: 10.1073/pnas.162471999. - DOI - PMC - PubMed
Publication types
MeSH terms
Grants and funding
LinkOut - more resources
Full Text Sources
Other Literature Sources
Research Materials
