The shape of the DNA minor groove directs binding by the DNA-bending protein Fis
- PMID: 20395367
- PMCID: PMC2854395
- DOI: 10.1101/gad.1900610
The shape of the DNA minor groove directs binding by the DNA-bending protein Fis
Abstract
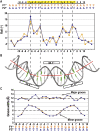
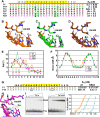
The bacterial nucleoid-associated protein Fis regulates diverse reactions by bending DNA and through DNA-dependent interactions with other control proteins and enzymes. In addition to dynamic nonspecific binding to DNA, Fis forms stable complexes with DNA segments that share little sequence conservation. Here we report the first crystal structures of Fis bound to high- and low-affinity 27-base-pair DNA sites. These 11 structures reveal that Fis selects targets primarily through indirect recognition mechanisms involving the shape of the minor groove and sequence-dependent induced fits over adjacent major groove interfaces. The DNA shows an overall curvature of approximately 65 degrees , and the unprecedented close spacing between helix-turn-helix motifs present in the apodimer is accommodated by severe compression of the central minor groove. In silico DNA structure models show that only the roll, twist, and slide parameters are sufficient to reproduce the changes in minor groove widths and recreate the curved Fis-bound DNA structure. Models based on naked DNA structures suggest that Fis initially selects DNA targets with intrinsically narrow minor grooves using the separation between helix-turn-helix motifs in the Fis dimer as a ruler. Then Fis further compresses the minor groove and bends the DNA to generate the bound structure.
Figures


Similar articles
-
Cooperative DNA binding by proteins through DNA shape complementarity.Nucleic Acids Res. 2019 Sep 19;47(16):8874-8887. doi: 10.1093/nar/gkz642. Nucleic Acids Res. 2019. PMID: 31616952 Free PMC article.
-
DNA Sequence Determinants Controlling Affinity, Stability and Shape of DNA Complexes Bound by the Nucleoid Protein Fis.PLoS One. 2016 Mar 9;11(3):e0150189. doi: 10.1371/journal.pone.0150189. eCollection 2016. PLoS One. 2016. PMID: 26959646 Free PMC article.
-
Biochemical identification of base and phosphate contacts between Fis and a high-affinity DNA binding site.J Mol Biol. 2008 Jul 4;380(2):327-39. doi: 10.1016/j.jmb.2008.04.075. Epub 2008 May 7. J Mol Biol. 2008. PMID: 18514225 Free PMC article.
-
Control of DNA minor groove width and Fis protein binding by the purine 2-amino group.Nucleic Acids Res. 2013 Jul;41(13):6750-60. doi: 10.1093/nar/gkt357. Epub 2013 May 9. Nucleic Acids Res. 2013. PMID: 23661683 Free PMC article.
-
The Fis protein: it's not just for DNA inversion anymore.Mol Microbiol. 1992 Nov;6(22):3257-65. doi: 10.1111/j.1365-2958.1992.tb02193.x. Mol Microbiol. 1992. PMID: 1484481 Review.
Cited by
-
Improved predictions of transcription factor binding sites using physicochemical features of DNA.Nucleic Acids Res. 2012 Dec;40(22):e175. doi: 10.1093/nar/gks771. Epub 2012 Aug 25. Nucleic Acids Res. 2012. PMID: 22923524 Free PMC article.
-
Force-Dependent Facilitated Dissociation Can Generate Protein-DNA Catch Bonds.Biophys J. 2019 Sep 17;117(6):1085-1100. doi: 10.1016/j.bpj.2019.07.044. Epub 2019 Aug 2. Biophys J. 2019. PMID: 31427067 Free PMC article.
-
Dps Is a Universally Conserved Dual-Action DNA-Binding and Ferritin Protein.J Bacteriol. 2022 May 17;204(5):e0003622. doi: 10.1128/jb.00036-22. Epub 2022 Apr 5. J Bacteriol. 2022. PMID: 35380871 Free PMC article. Review.
-
Proteins Recognizing DNA: Structural Uniqueness and Versatility of DNA-Binding Domains in Stem Cell Transcription Factors.Genes (Basel). 2017 Aug 1;8(8):192. doi: 10.3390/genes8080192. Genes (Basel). 2017. PMID: 28763006 Free PMC article. Review.
-
Genome-wide analysis of DNA uptake across the outer membrane of naturally competent Haemophilus influenzae.iScience. 2020 Dec 30;24(1):102007. doi: 10.1016/j.isci.2020.102007. eCollection 2021 Jan 22. iScience. 2020. PMID: 33490915 Free PMC article.
References
-
- Adams PD, Grosse-Kunstleve RW, Hung LW, Ioerger TR, McCoy AJ, Moriarty NW, Read RJ, Sacchettini JC, Sauter NK, Terwilliger TC 2002. PHENIX: Building new software for automated crystallographic structure determination. Acta Crystallogr D Biol Crystallogr 58: 1948–1954 - PubMed
-
- Aiyar SE, McLeod SM, Ross W, Hirvonen CA, Thomas MS, Johnson RC, Gourse RL 2002. Architecture of Fis-activated transcription complexes at the Escherichia coli rrnB P1 and rrnE P1 promoters. J Mol Biol 316: 501–516 - PubMed
-
- Benoff B, Yang H, Lawson CL, Parkinson G, Liu J, Blatter E, Ebright YW, Berman HM, Ebright RH 2002. Structural basis of transcription activation: The CAP–αCTD–DNA complex. Science 297: 1562–1566 - PubMed
-
- Bokal AJ, Ross W, Gourse RL 1995. The transcriptional activator protein FIS: DNA interactions and cooperative interactions with RNA polymerase at the Escherichia coli rrnB P1 promoter. J Mol Biol 245: 197–207 - PubMed
Publication types
MeSH terms
Substances
Grants and funding
LinkOut - more resources
Full Text Sources
Other Literature Sources
