. 2010 Apr 14;30(15):5136-48.
doi: 10.1523/JNEUROSCI.5711-09.2010.

Cholecystokinin facilitates glutamate release by increasing the number of readily releasable vesicles and releasing probability

Affiliations

Cholecystokinin facilitates glutamate release by increasing the number of readily releasable vesicles and releasing probability

Pan-Yue Deng et al. J Neurosci. .

Abstract

Cholecystokinin (CCK), a neuropeptide originally discovered in the gastrointestinal tract, is abundantly distributed in the mammalian brains including the hippocampus. Whereas CCK has been shown to increase glutamate concentration in the perfusate of hippocampal slices and in purified rat hippocampal synaptosomes, the cellular and molecular mechanisms whereby CCK modulates glutamatergic function remain unexplored. Here, we examined the effects of CCK on glutamatergic transmission in the hippocampus using whole-cell recordings from hippocampal slices. Application of CCK increased AMPA receptor-mediated EPSCs at perforant path-dentate gyrus granule cell, CA3-CA3 and Schaffer collateral-CA1 synapses without effects at mossy fiber-CA3 synapses. CCK-induced increases in AMPA EPSCs were mediated by CCK-2 receptors and were not modulated developmentally and transcriptionally. CCK reduced the coefficient of variation and paired-pulse ratio of AMPA EPSCs suggesting that CCK facilitates presynaptic glutamate release. CCK increased the release probability and the number of readily releasable vesicles with no effects on the rate of recovery from vesicle depletion. CCK-mediated increases in glutamate release required the functions of phospholipase C, intracellular Ca(2+) release and protein kinase Cgamma. CCK released endogenously from hippocampal interneurons facilitated glutamatergic transmission. Our results provide a cellular and molecular mechanism to explain the roles of CCK in the brain.


Figures

Figure 1.
Figure 1.
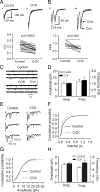
CCK increases AMPA EPSCs at hippocampal synapses via CCK-2 receptors. A, Bath application of CCK increased AMPA EPSCs at PP-GC synapses whereas application of vehicle (0.004% NH4OH) had no effects. The vertical axis was truncated to show the magnitude of the effect of CCK. Left panel shows the current traces averaged from 10 AMPA EPSCs before (a) and after (b) application of vehicle (top) or CCK (bottom). B, Amplitude distribution of AMPA EPSCs recorded at PP-GC synapses. Arrow indicates the criterion used to separate the responsive and the unresponsive synapses. C, Concentration–response curve of CCK by plotting the percentage of increases in the amplitudes of AMPA EPSCs recorded at the PP-GC synapses versus the concentrations of CCK. Numbers in the parenthesis are numbers of cells examined. D, Application of CCK-2 receptor antagonist, LY225910 (1 μm), not CCK-1 receptor antagonist, lorglumide (1 μm), blocked CCK-induced increases in AMPA EPSCs. Left, Top, Current traces averaged from 10 AMPA EPSCs in the presence of lorglumide alone (a) and after coapplication of CCK (b). Left, Bottom, Current traces averaged from 10 AMPA EPSCs in the presence of LY225910 alone (a) and after coapplication of CCK (b). E, Application of CCK increased AMPA EPSCs recorded from 11 cells in slices cut from 3 wild-type [CCK-2(+/+)] mice whereas CCK failed to change AMPA EPSCs recorded from 13 cells in slices cut from 4 knock-out [CCK-2(−/−)] mice. Left panel shows the current traces averaged from 10 AMPA EPSCs before (a) and after (b) application of CCK from wild-type (top) and knock-out (bottom) mice. F, There were no age-dependent changes in CCK-mediated increases in AMPA EPSCs and application of the transcriptional inhibitor, anisomycin (25 μm), failed to block CCK-induced increases in AMPA EPSCs. Numbers on the top of the bars indicate the number of cells recorded.
Figure 2.
Figure 2.
CCK facilitates presynaptic glutamate release by increasing quantal content. A, CCK reduced the coefficient of variation (CV = SD/mean) of AMPA EPSCs. SD and mean were obtained by averaging 15 consecutive EPSCs. Top shows 15 consecutive EPSCs recorded before (left) and during (right) the application of CCK. Bottom shows the calculated CVs from 20 cells (open circles) and their averages (solid circles). B, CCK reduced paired-pulse ratio (PPR = P2/P1, P1 and P2 are the EPSCs evoked by two stimuli at an interval of 20 ms). Top left, EPSCs averaged from 20 to 30 current traces before (bold) and during (thin) the application of CCK. Top right, EPSCs recorded before (bold) and during (thin) application of CCK were scaled to the first EPSC. Note that the second EPSC during the application of CCK is smaller than control. Bottom, PPRs recorded from 11 cells (open circles) and their averages (solid circles). C, mEPSCs recorded in the presence of TTX before and during the application of CCK. D, Summarized mEPSC frequency and amplitude (n = 20). E, Evoked AMPA EPSCs recorded from the same synapse in the presence of Sr2+ (6 mm) before and during application of CCK. Note that AMPA EPSCs recorded as asynchronous events in the extracellular solution containing Sr2+. Also note that application of CCK increased the frequency of asynchronous events recorded in the presence of Sr2+. F, Cumulative frequency distribution of asynchronous EPSCs in the presence of Sr2+ before and during the application of CCK. G, Cumulative amplitude distribution of asynchronous EPSCs in the presence of Sr2+ before and during the application of CCK. H, Summarized asynchronous EPSC frequency and amplitude (n = 7).
Figure 3.
Figure 3.
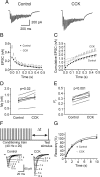
CCK increases the number of releasable vesicles and release probability without changing the rate of recovery from vesicle depletion. A, EPSC trains averaged from 15 traces evoked by 20 stimuli at 40 Hz before (left) and during (right) the application of CCK. Stimulation artifacts were blanked for clarity. B, EPSC amplitudes averaged from 6 cells in response to 20 stimuli at 40 Hz before and during the application of CCK. The amplitude of EPSC evoked by each stimulus was measured by resetting the base line each time at a point within 0.5 ms before the beginning of each stimulation artifact. C, Cumulative amplitude histogram of EPSCs. For each cell, the last 6 EPSC amplitudes were fit with a linear regression line and extrapolated to time 0 to estimate the readily releasable pool size (Nq). D, CCK increases Nq (n = 6). E, CCK increases release probability (Pr, n = 6). For each cell, Pr was calculated as the ratio of the first EPSC amplitude divided by its Nq obtained by linear fitting of the cumulative EPSC histogram. F, Top, Experimental protocol. A conditioning train (20 stimuli at 40 Hz) was followed by a test stimulus at various intervals (Δt = 0.1–10 s). This protocol was repeated every 30 s. Bottom, EPSCs evoked by the test pulse from the same synapse at different intervals were aligned and superimposed before (left) and during (right) application of CCK. Stimulation artifacts were blanked for clarity. G, time course of recovery from depletion before and during the application of CCK expressed as percentage recovery = (I testI ss)/(I firstI ss) × 100, where I test is the EPSC evoked by the test pulse, I ss is the steady-state current left after the conditioning train (the average of the last 5 EPSC evoked by the conditioning train), I first is the EPSC evoked by the first stimulus of the conditioning train. Data before (thick line) and during (thin line) the application of CCK from 6 cells were fit by a single exponential function.
Figure 4.
Figure 4.
CCK does not increase glutamate release by direct interaction with Ca2+ channels. A, Inhibition of P/Q-type Ca2+ channels failed to block CCK-mediated increases in AMPA EPSCs (n = 6). Top shows the averaged AMPA EPSCs recorded at the time points indicated in the figure. B, Inhibition of N-type Ca2+ channels failed to block CCK-mediated increases in AMPA EPSCs (n = 6). Insets are the averaged AMPA EPSCs recorded at the time points indicated in the figure. C, Hyperpolarizing current pulse injection caused the membrane potential to attain an early peak and then “sag” to a steady-state level in a stellate neuron. D, CCK did not modulate Ca2+ currents (I Ca) recorded from stellate neurons (n = 6). Insets show the current traces recorded before and during application of CCK for 20 min. E, F, CCK failed to alter I Ca recorded from stellate neurons after P/Q-type (n = 6) or N-type (n = 7) Ca2+ channels were blocked.
Figure 5.
Figure 5.
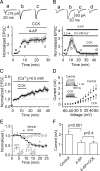
CCK increases glutamate release via inhibition of K+ channels. A, Application of 4-AP (40 μm) significantly increased AMPA EPSCs and blocked CCK-induced increases in AMPA EPSCs in the presence of 2.5 mm Ca2+ (n = 9). Top shows the current traces averaged from 10 AMPA EPSCs as indicated in the figure. B, CCK failed to significantly increase AMPA EPSCs when the Ca2+ concentration of extracellular solution was switched from 2.5 mm to 0.5 mm in the presence of 4-AP (40 μm, n = 8). C, CCK still increased AMPA EPSCs in the extracellular solution containing 0.5 mm Ca2+ (n = 5). D, CCK significantly inhibited I K recorded from stellate neurons (n = 5). Insets are I K recorded from a stellate neuron before and during the application of CCK (0.3 μm). Steady currents within 10 ms before the end of the depolarization pulse were measured and used to evaluate the effects of CCK on I K. E, Time course of the effect of CCK or vehicle (0.004% NH4OH) on I K recorded by depolarization from −60 mV to +40 mV every 30 s. Inset shows the currents recorded before (a) and during (b) the application of CCK or vehicle at the time points indicated in the figure. F, Summarized data showing that application of 4-AP (40 μm) inhibited I K and blocked CCK-mediated inhibition of I K (n = 10).
Figure 6.
Figure 6.
Signal transduction pathway underlying CCK-mediated increases in glutamate release. A, Pretreatment of slices with and bath application of U73122 (10 μm) blocked CCK-induced increases in AMPA EPSCs (n = 8) whereas the same treatment of slices with U73343 (10 μm) did not significantly change the effects of CCK (n = 10). Left panel shows the averaged AMPA EPSCs taken at the time points indicated in the figure in the presence of U73343 (upper) or U73122 (lower). B, Application of CCK significantly increased AMPA EPSCs in wild-type [PLCβ1(+/+)] mice (n = 9 cells in slices cut from 3 mice) but failed to change AMPA EPSCs in PLCβ1 knock-out [PLCβ1(−/−)] mice (n = 13 cells in slices cut from 4 mice). Left panel shows the averaged AMPA EPSCs recorded at the time points indicated in the figure from wild-type (top) and PLCβ1 knock-out (bottom) mice. C, CCK increased intracellular Ca2+ concentration in a cultured hippocampal neuron. D, Application of IP3 receptor inhibitor, 2-APB (50 μm), partially inhibited CCK-induced increases in AMPA EPSCs (n = 10) whereas application of PKC inhibitors, GF109203X (n = 7) and Ro318220 (n = 10), completely blocked CCK-induced increases in AMPA EPSCs (*p < 0.05, **p < 0.01 vs CCK alone). E, Application of CCK failed to increase AMPA EPSCs in PKCγ knock-out mice (n = 8 cells in slices cut from 3 mice) but still significantly increased AMPA EPSCs from wild-type (n = 7 cells in slices cut from 3 mice), PKCα (n = 8 cells in slices cut from 3 mice) and PKCβ (n = 7 cells in slices cut from 3 mice) knock-out mice.
Figure 7.
Figure 7.
Endogenously released CCK increases glutamate release at PP-GC synapses. A, An electrode filled with the extracellular solution was first placed in the molecular layer of the dentate gyrus for stimulation of perforant path. Two patch-clamp electrodes filled with intracellular solution containing 0.2% biocytin were sealed to a dentate granule cell and a pyramidal-like interneuron in the border of granular layer and the hilus, respectively. Depolarizing stimulation of interneurons generated increases in AMPA EPSCs recorded from granule cells evoked by stimulation of perforant path (n = 10). The same experiment was performed in the presence CCK-2 receptor inhibitor, YM022 (1 μm, n = 7). Note that interneuron stimulation in the presence of YM022 did not lead to an increase in AMPA EPSCs. B, C, The same experiments were performed except that the intracellular solution of the electrode sealed to the interneurons contained 20 mm BAPTA (B) or botulinum toxin C (BoTC, 5 μg/ml) (C). D, The recorded dentate gyrus granule cells (GC) and pyramidal-like interneurons located at the border of granular layer and hilus filled with biocytin were stained with Texas red-conjugated streptavidin (in red). Top, The expression of CCK in the interneurons (arrows) was detected by goat anti-CCK primary antibody and anti-goat IgG-FITC secondary antibody (in green). The merged image shows the recorded interneuron expressing CCK (in yellow). Bottom, No CCK immunoreactivity was detected when the primary CCK antibody was preabsorbed with a CCK blocking peptide in slices from which interneuron stimulation evoked an increase in AMPA EPSCs recorded at the PP-GC synapses confirming the specificity of CCK antibody.
Figure 8.
Figure 8.
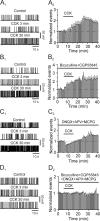
Contributions of CCK-induced modulation of GABAergic and glutamatergic transmission to the excitability of dentate granule cells recorded with perforated patches. A1, A2, CCK increased the firing frequency of APs recorded in normal extracellular solution. A1, APs recorded before (upper) and at the third (middle) and 30th (lower) minute after the beginning of CCK application. A2, Summarized time course of AP firing frequency (n = 12). B1, B2, CCK facilitated the firing frequency of APs recorded in the extracellular solution supplemented with inhibitors for GABAA (bicuculline) and GABAB (CGP55845) receptors. B1, APs recorded before (upper) and at the third (middle) and 30th (lower) minute after the beginning of CCK application. B2, Pooled time course of AP firing frequency (n = 10). C1, C2 , CCK transiently inhibited the early phase but augmented the late phase of AP firing frequency recorded in the extracellular solution containing inhibitors for glutamate receptors (DNQX, APV and MCPG). C1 , APs recorded before (upper) and at the third (middle) and 30th (lower) minute after the beginning of CCK application. C2 , Pooled time course of AP firing frequency (n = 11). D1, D2, CCK failed to alter AP firing frequency in the presence of inhibitors for glutamatergic and GABAergic transmission (n = 9). Figures were arranged in the same fashion.

Similar articles

Cited by

References

    1. Acsády L, Katona I, Martínez-Guijarro FJ, Buzsáki G, Freund TF. Unusual target selectivity of perisomatic inhibitory cells in the hilar region of the rat hippocampus. J Neurosci. 2000;20:6907–6919. - PMC - PubMed
    1. Barrie AP, Nicholls DG, Sanchez-Prieto J, Sihra TS. An ion channel locus for the protein kinase C potentiation of transmitter glutamate release from guinea pig cerebrocortical synaptosomes. J Neurochem. 1991;57:1398–1404. - PubMed
    1. Beinfeld MC. An introduction to neuronal cholecystokinin. Peptides. 2001;22:1197–1200. - PubMed
    1. Bergink V, van Megen HJ, Westenberg HG. Glutamate and anxiety. Eur Neuropsychopharmacol. 2004;14:175–183. - PubMed
    1. Boden PR, Hill RG. Effects of cholecystokinin and pentagastrin on rat hippocampal neurones maintained in vitro. Neuropeptides. 1988;12:95–103. - PubMed

Publication types

MeSH terms