. 2010 May 10;207(5):983-97.
doi: 10.1084/jem.20092437. Epub 2010 Apr 12.

Rnf8 deficiency impairs class switch recombination, spermatogenesis, and genomic integrity and predisposes for cancer

Affiliations

Rnf8 deficiency impairs class switch recombination, spermatogenesis, and genomic integrity and predisposes for cancer

Li Li et al. J Exp Med. .

Abstract

Signaling and repair of DNA double-strand breaks (DSBs) are critical for preventing immunodeficiency and cancer. These DNA breaks result from exogenous and endogenous DNA insults but are also programmed to occur during physiological processes such as meiosis and immunoglobulin heavy chain (IgH) class switch recombination (CSR). Recent studies reported that the E3 ligase RNF8 plays important roles in propagating DNA DSB signals and thereby facilitating the recruitment of various DNA damage response proteins, such as 53BP1 and BRCA1, to sites of damage. Using mouse models for Rnf8 mutation, we report that Rnf8 deficiency leads to impaired spermatogenesis and increased sensitivity to ionizing radiation both in vitro and in vivo. We also demonstrate the existence of alternative Rnf8-independent mechanisms that respond to irradiation and accounts for the partial recruitment of 53bp1 to sites of DNA damage in activated Rnf8(-/-) B cells. Remarkably, IgH CSR is impaired in a gene dose-dependent manner in Rnf8 mutant mice, revealing that these mice are immunodeficient. In addition, Rnf8(-/-) mice exhibit increased genomic instability and elevated risks for tumorigenesis indicating that Rnf8 is a novel tumor suppressor. These data unravel the in vivo pleiotropic effects of Rnf8.


Figures

Figure 1.
Figure 1.
Rnf8−/− MEFs exhibit proliferative defects and Rnf8−/− mice are growth retarded. (A) Rnf8−/− MEFs exhibited reduced ability to proliferate in vitro. Passage 2 WT and Rnf8−/− MEFs were seeded in 6-cm dishes at a density of 3 × 10⁵. After every 3 d, the MEFs were trypsinized, counted, and reseeded at the same density. The cumulative growth curves are shown. Three independent experiments were performed, and a Student’s t test was used for statistical analysis. *, P < 0.05. Error bars represent SD. (B) Passage 4 WT and Rnf8−/− MEFs were cultured as in A, either under normoxic (21% O2) or hypoxic (5% O2) conditions. Data were from two independent experiments. (C) Body weights of age-matched WT (n = 10), Rnf8+/− (n = 14), and Rnf8−/− (n = 9) males. Statistical significance was established at each time point using Student’s t test. *, P < 0.05. Error bars represent SD. (D) Total number of cells in BM (one femur) of WT and Rnf8−/− mice. (E) Absolute numbers of pro–B cells (IgMCD43+B220+), pre–B cells (IgMCD43B220+), and immature B cells (B220+IgM+IgD) in the BM (one femur) of WT and Rnf8−/− mice. (F) Absolute number of cells in thymus and spleen of WT and Rnf8−/− mice. (G) Absolute numbers of double-negative (CD4CD8), double-positive (CD4+CD8+), CD4+, and CD8+ cells in the thymus of WT and Rnf8−/− mice. (H) Absolute numbers of B and T cells in the spleen of WT and Rnf8−/− mice. Data in D–H were generated from seven pairs of WT and Rnf8−/− littermates at the age of 6–10 wk. Student’s t test was used for statistical analysis. *, P < 0.05; **, P < 0.0007. Error bars represent SD.
Figure 2.
Figure 2.
Impaired spermatogenesis in Rnf8−/− mice. (A and B) Histological analysis of ovaries of WT (A) and Rnf8−/− (B) females showed no significant differences in ovarian architecture. Bars, 50 µm. (C) Testes from 12-mo-old Rnf8−/− male exhibited a significant reduction in size compared with those of WT littermates. Bar, 0.25 cm. (D–K) Images of H&E-stained seminiferous tubules from 1.5-mo-old WT (D and H) and Rnf8−/− (E, F, I, and J) mice and a 3.5-mo-old Rnf8−/− male (G and K). H&E staining of testes from Rnf8−/− males showed a spectrum of alterations in spermatogenesis. Rnf8−/− testis showed seminiferous tubules with well-populated layers of spermatogonia, spermatocytes, and mature spermatozoa (E and I) and other seminiferous tubules with only few or absent mature spermatozoa in the lumen and an unusually elevated number of immature spermatids and mitotic cells (E and I). Rnf8−/− testis showed disorganized epithelial architecture of seminiferous tubules, few spermatogonia and spermatocytes mixed together with apoptotic bodies, and the absence of mature sperm cells (F and J). Rnf8−/− testis showed focal vacuolar degeneration of most seminiferous tubules (G and K). In contrast to WT (L), H&E staining of epididymis of Rnf8−/− mice (M, 20X) show no histological abnormalities; however, they have a significant reduction of mature sperms. Bars: (D–G) 100 µm; (H–K) 50 µm; (L and M) 100 µm. A minimum of five mice per genotype have been analyzed.
Figure 3.
Figure 3.
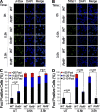
Partial recruitment of 53bp1 to the sites of DNA damage in the absence of Rnf8. (A and B) LPS-activated B cells either untreated (0 h) or harvested 0.5 and 3.5 h after 3 Gy irradiation were stained with anti-γH2ax (A) and anti-53bp1 (B) antibodies. Images were taken with a confocal microscope. Bars, 10 µm. (C and D) Quantitative analysis of γH2ax and 53bp1 subnuclear foci. Activated B cells harboring two or more than two foci were counted as foci-positive cells. Three independent experiments were performed, and a minimum of 300 cells was counted for each condition and genotype. A Student’s t test was used for statistical analysis. *, P < 0.01. Error bars represent SD.
Figure 4.
Figure 4.
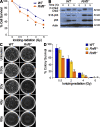
Rnf8−/− thymocytes and BM cells display increased radiosensitivity. (A) Thymocytes from WT and Rnf8−/− littermates were either left untreated or treated with various dosages of γ radiation. Cells were then stained with 7-AAD 18 h after treatment and analyzed by flow cytometry. Data from all treated samples were normalized to their respective untreated samples, and percentages of viable cells were plotted. Three independent experiments were performed. Student’s t test was used for statistical analysis. *, P < 0.05. Error bars represent SD. (B) Thymocytes from Rnf8−/− mice and WT littermates were either left untreated (0) or irradiated with 2 Gy of γ radiation and harvested at 2 and 5 h after treatment. Western blot analysis was performed to examine protein levels of Chk2, Ser15 phosphorylated p53 (S15-p53), and total p53. Actin was used as a loading control. (C) Representative pictures of dishes showing colonies derived from WT and Rnf8−/− BM cells either left untreated or irradiated with the indicated doses (0.5–6 Gy). All the pictures were taken at day 10 of culture. (D) Quantitative analysis showing the percentages of surviving colonies. Three independent experiments were performed. Data from all treated samples were normalized to their respective untreated samples, and Student’s t test was used for statistical analysis. *, P < 0.05 (statistically significant difference between WT and Rnf8+/− colony survivals); **, P < 0.02 (statistically significant difference of Rnf8−/− compared with WT and Rnf8+/− colony survivals). Error bars represent SD.
Figure 5.
Figure 5.
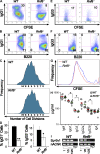
Impaired Igh CSR in Rnf8−/− B cells. (A and B) Flow cytometric analysis of IgG1 expression was performed on CFSE-labeled B cells 4.5 d after anti-CD40 and IL4 stimulation. Populations of IgG1+ switched cells were outlined by the boxes with percentages indicated. Results are representative of four independent experiments. (C) Cell divisions tracked by CFSE, after 4.5 d of stimulation with anti-CD40 plus IL4, were analyzed by flow cytometry. Each peak indicates a cell division. (D) Percentages of switched cells under anti-CD40 and IL4 stimulation for 4.5 d from four independent experiments (left) and percentages of switched cells under LPS stimulation for 4.5 d from three independent experiments (right). Statistical significance was established by Student’s t test. *, P < 0.05; **, P < 0.0002. Error bars represent SD. (E and F) Flow cytometric analysis of IgG3 expression was performed on CFSE-labeled B cells 4.5 d after LPS stimulation. Populations of IgG3+ switched cells were outlined by the boxes with percentages indicated. Three independent experiments were performed. (G) Cell division profiles of WT and Rnf8−/− B cells tracked by CFSE at day 4.5 after LPS stimulation. (H) Isotypes of serum Ig’s quantified in 14-mo-old Rnf8−/− (n = 8) and WT (n = 8) mice. Red horizontal bars represent the mean value of serum Ig levels of WT mice, whereas the green bars represent the mean value of serum Ig levels of Rnf8−/− mice. Student’s t test was used for statistical analysis. *, P < 0.05. (I) Sμ-Sγ1 recombination products were quantified by digestion-circularization PCR analysis. Genomic DNA was obtained from B cells stimulated for 4 d with anti-CD40 and IL4. Fivefold dilutions of the genomic DNA were used as templates in the PCR reactions. nAChR was used as the control DNA. H2O indicates no input DNA. Results are representative of three independent experiments.
Figure 6.
Figure 6.
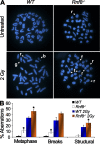
Rnf8 deficiency leads to increased genomic instability. (A) Representative metaphases of WT and Rnf8−/− LPS-activated B cells. Cells were either left untreated or irradiated with 2 Gy of γ radiation and harvested 12 h after treatment. (B) The graph shows the incidence of total spontaneous and IR-induced chromosomal aberrations. A minimum of 40 metaphase spreads of untreated or irradiated Rnf8−/− and WT cells were analyzed for each genotype and treatment in three independent experiments. Data are presented as mean ± SD. *, P < 0.05 compared with WT. r, ring; b, break; f, fragment; g, gap.
Figure 7.
Figure 7.
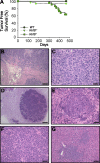
Rnf8 is a novel tumor suppressor. (A) Kaplan-Meier tumor-free survival analysis for cohorts of WT (n = 28), Rnf8+/− (n = 29), and Rnf8−/− (n = 22) mice. Mice were monitored for survival for 465 d. A log-rank test was used for statistical analysis. There was a statistically significant difference between WT and Rnf8−/− curves (P < 0.0005) and between Rnf8+/− and Rnf8−/− curves (P < 0.01). (B and C) Sarcoma invading soft tissues, including skeletal muscle, adipose tissue, and a peripheral nerve, is shown (B). High magnification shows that the tumor is poorly differentiated and has a high proliferative index and atypical mitosis (C). (D) Malignant transformation of the mammary gland with a multinodular growth pattern and invasion into adjacent connective tissues. The tumor is well vascularised and shows no necrosis. (E) A higher magnification shows that tumor cells are growing in small groups, with prominent mitosis and invasion. (F) A tumor composed of small cells with round, sometimes eccentric nuclei and small cytoplasm, is compatible with a lymphoma of B cell origin. (G) Despite its well differentiated appearance, this tumor aggressively infiltrates the periportal areas of the liver. Bars: (B) 100 µm; (C, E, and F) 25 µm; (D) 250 µm; (G) 50 µm.

Similar articles

Cited by

References

    1. Barlow C., Hirotsune S., Paylor R., Liyanage M., Eckhaus M., Collins F., Shiloh Y., Crawley J.N., Ried T., Tagle D., Wynshaw-Boris A. 1996. Atm-deficient mice: a paradigm of ataxia telangiectasia. Cell. 86:159–171 10.1016/S0092-8674(00)80086-0 - DOI - PubMed
    1. Bartek J., Lukas J. 2007. DNA damage checkpoints: from initiation to recovery or adaptation. Curr. Opin. Cell Biol. 19:238–245 10.1016/j.ceb.2007.02.009 - DOI - PubMed
    1. Bartek J., Bartkova J., Lukas J. 2007. DNA damage signalling guards against activated oncogenes and tumour progression. Oncogene. 26:7773–7779 10.1038/sj.onc.1210881 - DOI - PubMed
    1. Bristow R.G., Hill R.P. 2008. Hypoxia and metabolism. Hypoxia, DNA repair and genetic instability. Nat. Rev. Cancer. 8:180–192 10.1038/nrc2344 - DOI - PubMed
    1. Celeste A., Petersen S., Romanienko P.J., Fernandez-Capetillo O., Chen H.T., Sedelnikova O.A., Reina-San-Martin B., Coppola V., Meffre E., Difilippantonio M.J., et al. 2002. Genomic instability in mice lacking histone H2AX. Science. 296:922–927 10.1126/science.1069398 - DOI - PMC - PubMed

Publication types

MeSH terms

Substances