

In vitro screening of environmental chemicals for targeted testing prioritization: the ToxCast project
- PMID: 20368123
- PMCID: PMC2854724
- DOI: 10.1289/ehp.0901392
In vitro screening of environmental chemicals for targeted testing prioritization: the ToxCast project
Abstract
Background: Chemical toxicity testing is being transformed by advances in biology and computer modeling, concerns over animal use, and the thousands of environmental chemicals lacking toxicity data. The U.S. Environmental Protection Agency's ToxCast program aims to address these concerns by screening and prioritizing chemicals for potential human toxicity using in vitro assays and in silico approaches.
Objectives: This project aims to evaluate the use of in vitro assays for understanding the types of molecular and pathway perturbations caused by environmental chemicals and to build initial prioritization models of in vivo toxicity.
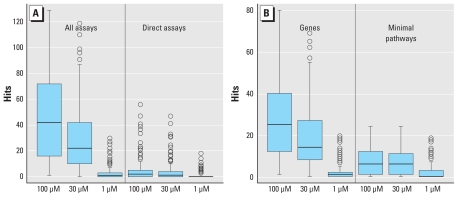
Methods: We tested 309 mostly pesticide active chemicals in 467 assays across nine technologies, including high-throughput cell-free assays and cell-based assays, in multiple human primary cells and cell lines plus rat primary hepatocytes. Both individual and composite scores for effects on genes and pathways were analyzed.
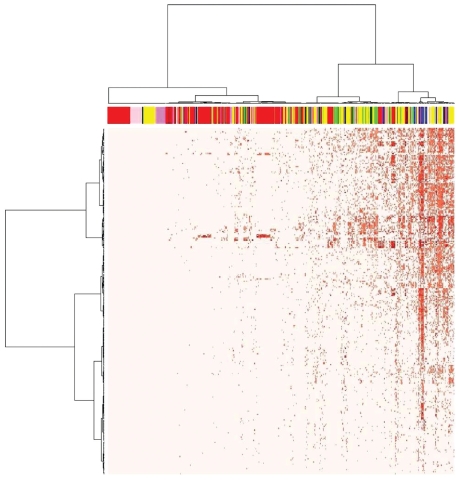
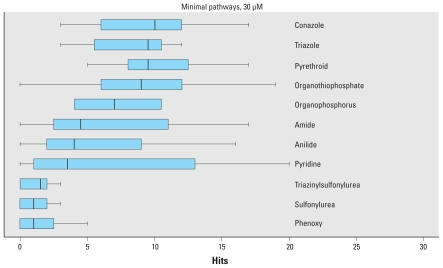
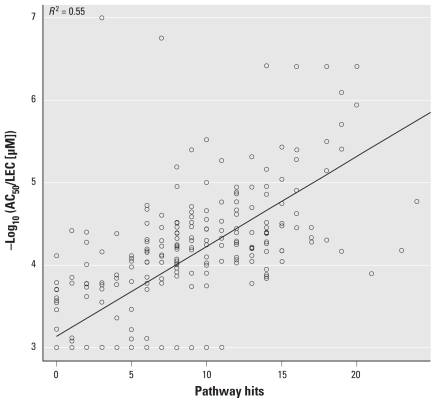
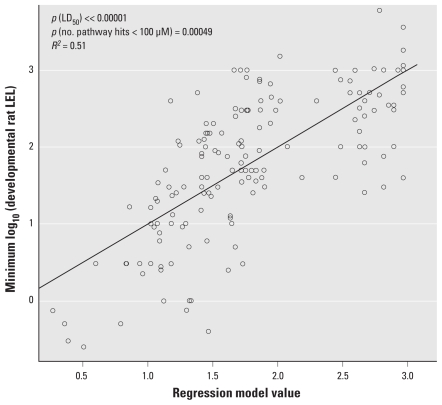
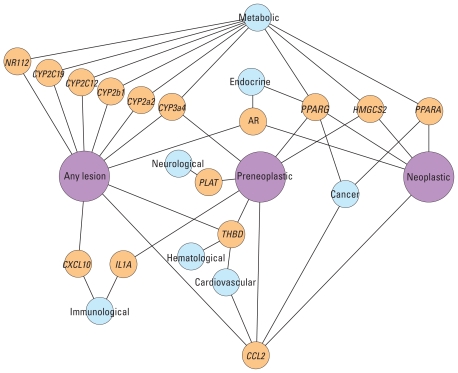
Results: Chemicals displayed a broad spectrum of activity at the molecular and pathway levels. We saw many expected interactions, including endocrine and xenobiotic metabolism enzyme activity. Chemicals ranged in promiscuity across pathways, from no activity to affecting dozens of pathways. We found a statistically significant inverse association between the number of pathways perturbed by a chemical at low in vitro concentrations and the lowest in vivo dose at which a chemical causes toxicity. We also found associations between a small set of in vitro assays and rodent liver lesion formation.
Conclusions: This approach promises to provide meaningful data on the thousands of untested environmental chemicals and to guide targeted testing of environmental contaminants.
Figures
Comment in
-
ToxCast on target: in vitro assays and computer modeling show promise for screening chemicals.Environ Health Perspect. 2010 Apr;118(4):A172. doi: 10.1289/ehp.118-a172a. Environ Health Perspect. 2010. PMID: 20359977 Free PMC article. No abstract available.
Similar articles
-
Predictive model of rat reproductive toxicity from ToxCast high throughput screening.Biol Reprod. 2011 Aug;85(2):327-39. doi: 10.1095/biolreprod.111.090977. Epub 2011 May 12. Biol Reprod. 2011. PMID: 21565999
-
Endocrine profiling and prioritization of environmental chemicals using ToxCast data.Environ Health Perspect. 2010 Dec;118(12):1714-20. doi: 10.1289/ehp.1002180. Epub 2010 Sep 8. Environ Health Perspect. 2010. PMID: 20826373 Free PMC article.
-
Computational toxicology as implemented by the U.S. EPA: providing high throughput decision support tools for screening and assessing chemical exposure, hazard and risk.J Toxicol Environ Health B Crit Rev. 2010 Feb;13(2-4):197-217. doi: 10.1080/10937404.2010.483935. J Toxicol Environ Health B Crit Rev. 2010. PMID: 20574897
-
In vitro and modelling approaches to risk assessment from the U.S. Environmental Protection Agency ToxCast programme.Basic Clin Pharmacol Toxicol. 2014 Jul;115(1):69-76. doi: 10.1111/bcpt.12239. Epub 2014 Apr 22. Basic Clin Pharmacol Toxicol. 2014. PMID: 24684691 Review.
-
The toxicity data landscape for environmental chemicals.Environ Health Perspect. 2009 May;117(5):685-95. doi: 10.1289/ehp.0800168. Epub 2008 Dec 22. Environ Health Perspect. 2009. PMID: 19479008 Free PMC article. Review.
Cited by
-
The Tox21 robotic platform for the assessment of environmental chemicals--from vision to reality.Drug Discov Today. 2013 Aug;18(15-16):716-23. doi: 10.1016/j.drudis.2013.05.015. Epub 2013 May 31. Drug Discov Today. 2013. PMID: 23732176 Free PMC article. Review.
-
Intake to production ratio: a measure of exposure intimacy for manufactured chemicals.Environ Health Perspect. 2012 Dec;120(12):1678-83. doi: 10.1289/ehp.1204992. Epub 2012 Sep 25. Environ Health Perspect. 2012. PMID: 23222017 Free PMC article.
-
Predictive modeling of estrogen receptor agonism, antagonism, and binding activities using machine- and deep-learning approaches.Lab Invest. 2021 Apr;101(4):490-502. doi: 10.1038/s41374-020-00477-2. Epub 2020 Aug 10. Lab Invest. 2021. PMID: 32778734 Free PMC article.
-
Selecting a minimal set of androgen receptor assays for screening chemicals.Regul Toxicol Pharmacol. 2020 Nov;117:104764. doi: 10.1016/j.yrtph.2020.104764. Epub 2020 Aug 14. Regul Toxicol Pharmacol. 2020. PMID: 32798611 Free PMC article.
-
Identifying Chemicals and Mixtures of Potential Biological Concern Detected in Passive Samplers from Great Lakes Tributaries Using High-Throughput Data and Biological Pathways.Environ Toxicol Chem. 2021 Aug;40(8):2165-2182. doi: 10.1002/etc.5118. Epub 2021 Jul 8. Environ Toxicol Chem. 2021. PMID: 34003517 Free PMC article.
References
-
- Abbott BD. Review of the expression of peroxisome proliferators-activated receptors alpha (PPARalpha), beta (PPARbeta), and gamma (PPARgamma) in rodent and human development. Reprod Toxicol. 2008;27(3–4):246–257. - PubMed
-
- Brandt U, Schagger H, von Jagow G. Characterisation of binding of the methoxyacrylate inhibitors to mitochondrial cytochrome c reductase. Eur J Biochem. 1988;173(3):499–506. - PubMed
-
- Butler EG, Tanaka T, Ichida T, Maruyama H, Leber AP, Williams GM. Induction of hepatic peroxisome proliferation in mice by lactofen, a diphenyl ether herbicide. Toxicol Appl Pharmacol. 1988;93(1):72–80. - PubMed
-
- Centers for Disease Control and Prevention. Third National Report on Human Exposure to Environmental Chemicals. Atlanta, GA: Centers for Disease Control and Prevention; 2005.
-
- Chapin RE, Adams J, Boekelheide K, Gray LE, Jr, Hayward SW, Lees PS, et al. NTP-CERHR expert panel report on the reproductive and developmental toxicity of bisphenol A. Birth Defects Res B Dev Reprod Toxicol. 2008;83(3):157–395. - PubMed
Publication types
MeSH terms
Substances
LinkOut - more resources
Full Text Sources
