

Insulin and insulin-like growth factor-1 receptors act as ligand-specific amplitude modulators of a common pathway regulating gene transcription
- PMID: 20360006
- PMCID: PMC2878077
- DOI: 10.1074/jbc.M110.118620
Insulin and insulin-like growth factor-1 receptors act as ligand-specific amplitude modulators of a common pathway regulating gene transcription
Abstract
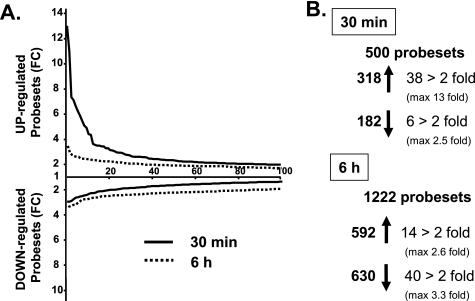
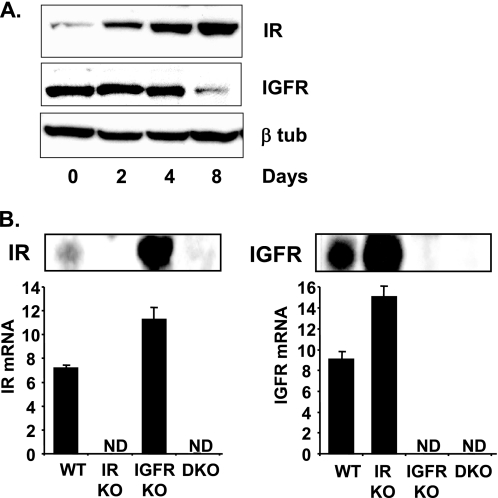
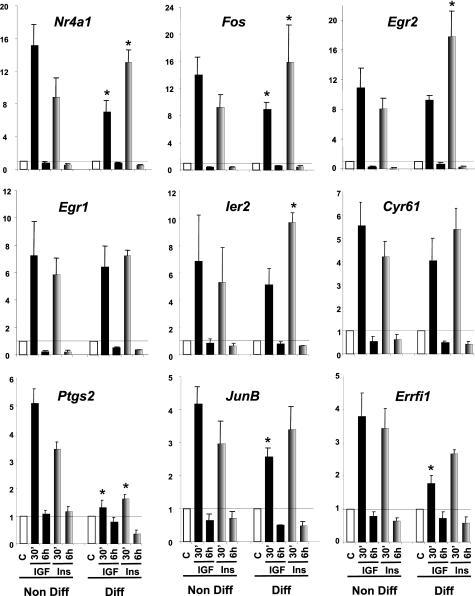
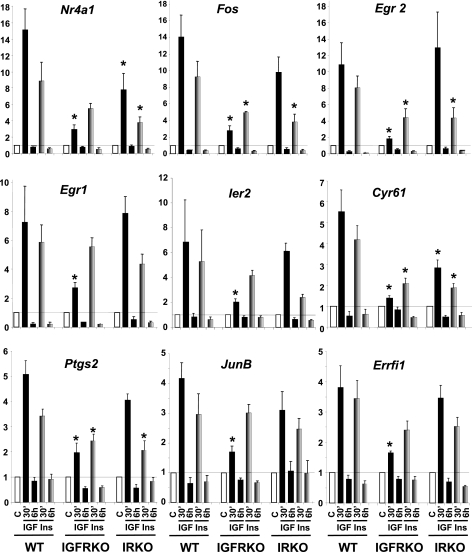
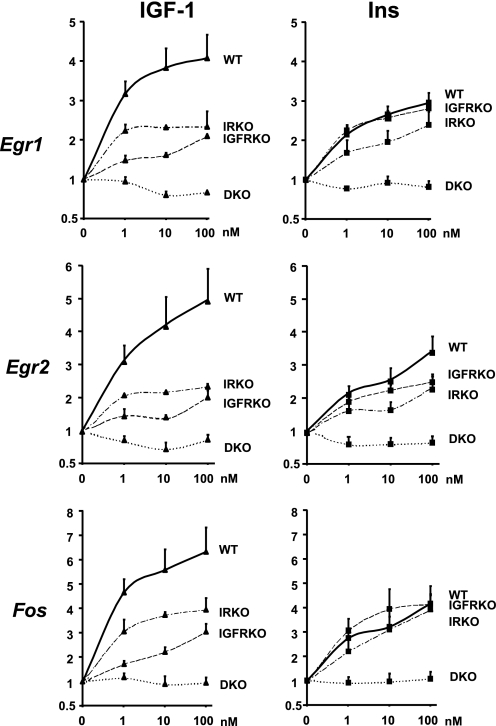
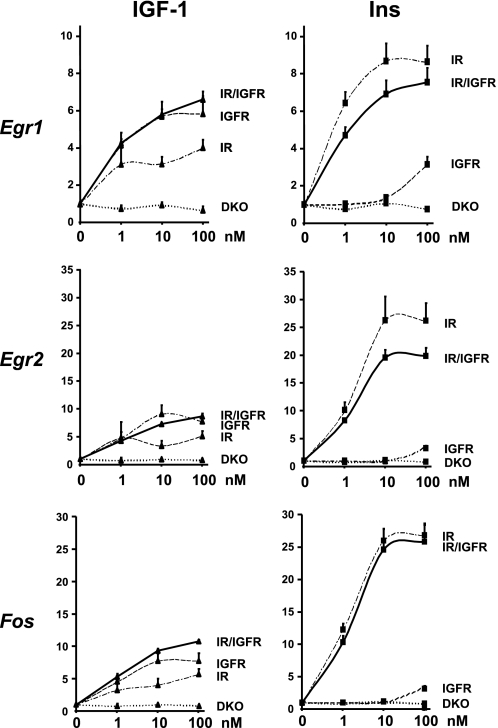
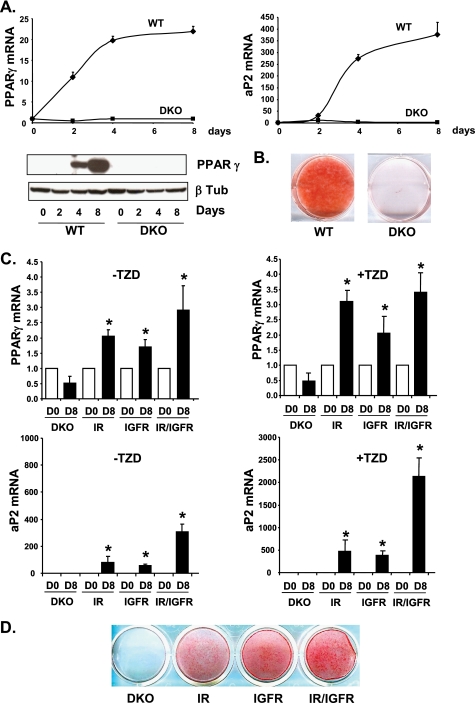
Insulin and insulin-like growth factor-1 (IGF-1) act on highly homologous receptors, yet in vivo elicit distinct effects on metabolism and growth. To investigate how the insulin and IGF-1 receptors exert specificity in their biological responses, we assessed their role in the regulation of gene expression using three experimental paradigms: 1) preadipocytes before and after differentiation into adipocytes that express both receptors, but at different ratios; 2) insulin receptor (IR) or IGF1R knock-out preadipocytes that only express the complimentary receptor; and 3) IR/IGF1R double knock-out (DKO) cells reconstituted with the IR, IGF1R, or both. In wild-type preadipocytes, which express predominantly IGF1R, microarray analysis revealed approximately 500 IGF-1 regulated genes (p < 0.05). The largest of these were confirmed by quantitative PCR, which also revealed that insulin produced a similar effect, but with a smaller magnitude of response. After differentiation, when IR levels increase and IGF1R decrease, insulin became the dominant regulator of each of these genes. Measurement of the 50 most highly regulated genes by quantitative PCR did not reveal a single gene regulated uniquely via the IR or IGF1R using cells expressing exclusively IGF-1 or insulin receptors. Insulin and IGF-1 dose responses from 1 to 100 nm in WT, IRKO, IGFRKO, and DKO cells re-expressing IR, IGF1R, or both showed that insulin and IGF-1 produced effects in proportion to the concentration of ligand and the specific receptor on which they act. Thus, IR and IGF1R act as identical portals to the regulation of gene expression, with differences between insulin and IGF-1 effects due to a modulation of the amplitude of the signal created by the specific ligand-receptor interaction.
Figures
Similar articles
-
Differential roles of the insulin and insulin-like growth factor-I (IGF-I) receptors in response to insulin and IGF-I.J Biol Chem. 2004 Sep 3;279(36):38016-24. doi: 10.1074/jbc.M313201200. Epub 2004 Jul 7. J Biol Chem. 2004. PMID: 15247278
-
Microarray analysis of insulin and insulin-like growth factor-1 (IGF-1) receptor signaling reveals the selective up-regulation of the mitogen heparin-binding EGF-like growth factor by IGF-1.J Biol Chem. 2002 Nov 8;277(45):42480-7. doi: 10.1074/jbc.M206206200. Epub 2002 Sep 3. J Biol Chem. 2002. PMID: 12213819
-
A kinase-independent role for unoccupied insulin and IGF-1 receptors in the control of apoptosis.Sci Signal. 2010 Dec 7;3(151):ra87. doi: 10.1126/scisignal.2001173. Sci Signal. 2010. PMID: 21139139 Free PMC article.
-
Microarray analysis and identification of novel molecules involved in insulin-like growth factor-1 receptor signaling and gene expression.Recent Prog Horm Res. 2003;58:325-42. doi: 10.1210/rp.58.1.325. Recent Prog Horm Res. 2003. PMID: 12795426 Review.
-
Minireview: nuclear insulin and insulin-like growth factor-1 receptors: a novel paradigm in signal transduction.Endocrinology. 2013 May;154(5):1672-9. doi: 10.1210/en.2012-2165. Epub 2013 Mar 18. Endocrinology. 2013. PMID: 23507573 Review.
Cited by
-
Prostate carcinogenesis with diabetes and androgen-deprivation-therapy-related diabetes: an update.Exp Diabetes Res. 2012;2012:801610. doi: 10.1155/2012/801610. Epub 2012 Jun 26. Exp Diabetes Res. 2012. PMID: 22792092 Free PMC article. Review.
-
Brown fat determination and development from muscle precursor cells by novel action of bone morphogenetic protein 6.PLoS One. 2014 Mar 21;9(3):e92608. doi: 10.1371/journal.pone.0092608. eCollection 2014. PLoS One. 2014. PMID: 24658703 Free PMC article.
-
Rab5a activates IRS1 to coordinate IGF-AKT-mTOR signaling and myoblast differentiation during muscle regeneration.Cell Death Differ. 2020 Aug;27(8):2344-2362. doi: 10.1038/s41418-020-0508-1. Epub 2020 Feb 12. Cell Death Differ. 2020. PMID: 32051546 Free PMC article.
-
Acute knockdown of the insulin receptor or its substrates Irs1 and 2 in 3T3-L1 adipocytes suppresses adiponectin production.Sci Rep. 2016 Feb 18;6:21105. doi: 10.1038/srep21105. Sci Rep. 2016. PMID: 26888756 Free PMC article.
-
Loss of MyoD Promotes Fate Transdifferentiation of Myoblasts Into Brown Adipocytes.EBioMedicine. 2017 Feb;16:212-223. doi: 10.1016/j.ebiom.2017.01.015. Epub 2017 Jan 13. EBioMedicine. 2017. PMID: 28117277 Free PMC article.
References
-
- Siddle K., Ursø B., Niesler C. A., Cope D. L., Molina L., Surinya K. H., Soos M. A. (2001) Biochem. Soc. Trans. 29, 513–525 - PubMed
-
- Baker J., Liu J. P., Robertson E. J., Efstratiadis A. (1993) Cell 75, 73–82 - PubMed
-
- Accili D., Drago J., Lee E. J., Johnson M. D., Cool M. H., Salvatore P., Asico L. D., José P. A., Taylor S. I., Westphal H. (1996) Nat. Genet. 12, 106–109 - PubMed
Publication types
MeSH terms
Substances
Grants and funding
LinkOut - more resources
Full Text Sources
Other Literature Sources
Medical
Miscellaneous
