

Trajectories of disability in the last year of life
- PMID: 20357280
- PMCID: PMC2877372
- DOI: 10.1056/NEJMoa0909087
Trajectories of disability in the last year of life
Abstract
Background: Despite the importance of functional status to older persons and their families, little is known about the course of disability at the end of life.
Methods: We evaluated data on 383 decedents from a longitudinal study involving 754 community-dwelling older persons. None of the subjects had disability in essential activities of daily living at the beginning of the study, and the level of disability was ascertained during monthly interviews for more than 10 years. Information on the conditions leading to death was obtained from death certificates and comprehensive assessments that were completed at 18-month intervals after the baseline assessment.
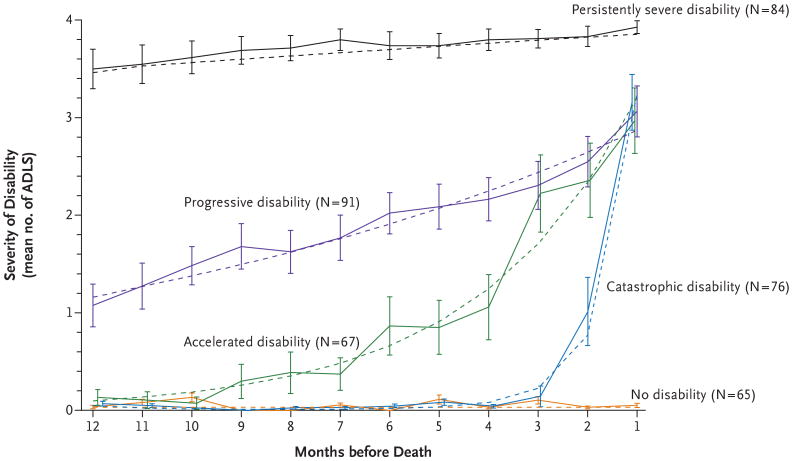
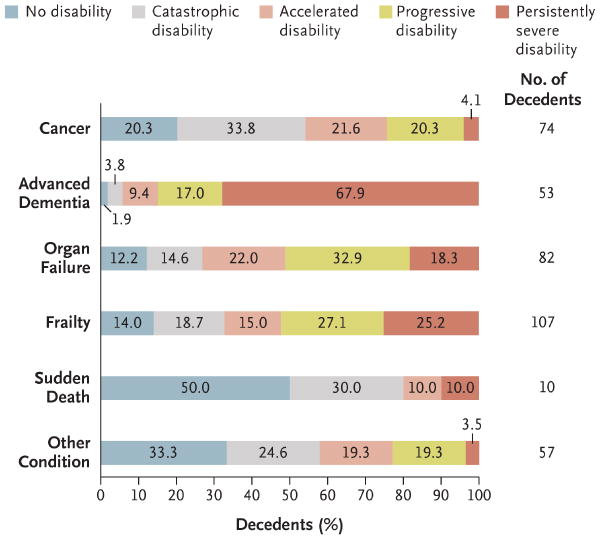
Results: In the last year of life, five distinct trajectories were identified, from no disability to the most severe disability: 65 subjects had no disability (17.0%), 76 had catastrophic disability (19.8%), 67 had accelerated disability (17.5%), 91 had progressive disability (23.8%), and 84 had persistently severe disability (21.9%). The most common condition leading to death was frailty (in 107 subjects [27.9%]), followed by organ failure (in 82 subjects [21.4%]), cancer (in 74 subjects [19.3%]), other causes (in 57 subjects [14.9%]), advanced dementia (in 53 subjects [13.8%]), and sudden death (in 10 subjects [2.6%]). When the distribution of the disability trajectories was evaluated according to the conditions leading to death, a predominant trajectory was observed only for subjects who died from advanced dementia (67.9% of these subjects had a trajectory of persistently severe disability) and sudden death (50.0% of these subjects had no disability). For the four other conditions leading to death, no more than 34% of the subjects had any of the disability trajectories. The distribution of disability trajectories was particularly heterogeneous among the subjects with organ failure (from 12.2 to 32.9% of the subjects followed a specific trajectory) and frailty (from 14.0 to 27.1% of the subjects followed a specific trajectory).
Conclusions: In most of the decedents, the course of disability in the last year of life did not follow a predictable pattern based on the condition leading to death.
2010 Massachusetts Medical Society
Conflict of interest statement
Disclosures provided by the authors are available with the full text of this article at
Figures
Comment in
-
Trajectories of disability in the last year of life.N Engl J Med. 2010 Jul 15;363(3):294; author reply 295. doi: 10.1056/NEJMc1005305. N Engl J Med. 2010. PMID: 20647207 No abstract available.
-
Trajectories of disability in the last year of life.N Engl J Med. 2010 Jul 15;363(3):294; author reply 295. N Engl J Med. 2010. PMID: 20665928 No abstract available.
Similar articles
-
The role of intervening hospital admissions on trajectories of disability in the last year of life: prospective cohort study of older people.BMJ. 2015 May 20;350:h2361. doi: 10.1136/bmj.h2361. BMJ. 2015. PMID: 25995357 Free PMC article.
-
Trajectories of Late-Life Disability Vary by the Condition Leading to Death.J Gerontol A Biol Sci Med Sci. 2021 Jun 14;76(7):1260-1264. doi: 10.1093/gerona/glaa234. J Gerontol A Biol Sci Med Sci. 2021. PMID: 32939547 Free PMC article.
-
Comparisons between older men and women in the trajectory and burden of disability over the course of nearly 14 years.J Am Med Dir Assoc. 2013 Apr;14(4):280-6. doi: 10.1016/j.jamda.2012.11.011. Epub 2013 Jan 4. J Am Med Dir Assoc. 2013. PMID: 23294968 Free PMC article.
-
Dementia as a predictor of functional disability: a four-year follow-up study.Gerontology. 2002 Jul-Aug;48(4):226-33. doi: 10.1159/000058355. Gerontology. 2002. PMID: 12053112 Review.
-
Disentangling the disabling process: insights from the precipitating events project.Gerontologist. 2014 Aug;54(4):533-49. doi: 10.1093/geront/gnu067. Gerontologist. 2014. PMID: 25035454 Free PMC article. Review.
Cited by
-
Quantitative measures of healthy aging and biological age.Healthy Aging Res. 2015;4:26. doi: 10.12715/har.2015.4.26. Healthy Aging Res. 2015. PMID: 26005669 Free PMC article.
-
Characteristics of people diagnosed with dementia vs lung cancer and cardiovascular disease at commencement of community palliative care: a population-based study.BMC Palliat Care. 2024 Sep 4;23(1):219. doi: 10.1186/s12904-024-01545-w. BMC Palliat Care. 2024. PMID: 39232699 Free PMC article.
-
Executive summary of the KDIGO Controversies Conference on Supportive Care in Chronic Kidney Disease: developing a roadmap to improving quality care.Kidney Int. 2015 Sep;88(3):447-59. doi: 10.1038/ki.2015.110. Epub 2015 Apr 29. Kidney Int. 2015. PMID: 25923985
-
Lifestyle risk factors predict disability and death in healthy aging adults.Am J Med. 2012 Feb;125(2):190-7. doi: 10.1016/j.amjmed.2011.08.006. Am J Med. 2012. PMID: 22269623 Free PMC article.
-
Continuity of physician care over the last year of life for different cause-of-death categories: a retrospective population-based study.CMAJ Open. 2022 Nov 8;10(4):E971-E980. doi: 10.9778/cmajo.20210294. Print 2022 Oct-Dec. CMAJ Open. 2022. PMID: 36347560 Free PMC article.
References
-
- Fries JF. Aging, natural death, and the compression of morbidity. N Engl J Med. 1980;303:130–5. - PubMed
-
- Freedman VA, Martin LG, Schoeni RF. Recent trends in disability and functioning among older adults in the United States: a systematic review. JAMA. 2002;288:3137–46. - PubMed
-
- Liao Y, McGee DL, Cao G, Cooper RS. Black-white differences in disability and morbidity in the last years of life. Am J Epidemiol. 1999;149:1097–103. - PubMed
Publication types
MeSH terms
Grants and funding
LinkOut - more resources
Full Text Sources