. 2010 Jun 1;21(11):1836-49.
doi: 10.1091/mbc.e10-01-0016. Epub 2010 Mar 31.

Arf3 is activated uniquely at the trans-Golgi network by brefeldin A-inhibited guanine nucleotide exchange factors

Affiliations

Arf3 is activated uniquely at the trans-Golgi network by brefeldin A-inhibited guanine nucleotide exchange factors

Florin Manolea et al. Mol Biol Cell. .

Abstract

It is widely assumed that class I and II Arfs function interchangeably throughout the Golgi complex. However, we report here that in vivo, Arf3 displays several unexpected properties. Unlike other Golgi-localized Arfs, Arf3 associates selectively with membranes of the trans-Golgi network (TGN) in a manner that is both temperature-sensitive and uniquely dependent on guanine nucleotide exchange factors of the BIGs family. For example, BIGs knockdown redistributed Arf3 but not Arf1 from Golgi membranes. Furthermore, shifting temperature to 20 degrees C, a temperature known to block cargo in the TGN, selectively redistributed Arf3 from Golgi membranes. Arf3 redistribution occurred slowly, suggesting it resulted from a change in membrane composition. Arf3 knockdown and overexpression experiments suggest that redistribution is not responsible for the 20 degrees C block. To investigate in more detail the mechanism for Arf3 recruitment and temperature-dependent release, we characterized several mutant forms of Arf3. This analysis demonstrated that those properties are readily separated and depend on pairs of residues present at opposite ends of the protein. Furthermore, phylogenetic analysis established that all four critical residues were absolutely conserved and unique to Arf3. These results suggest that Arf3 plays a unique function at the TGN that likely involves recruitment by a specific receptor.


Figures
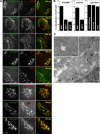
Figure 1.
Figure 1.
Arf3 localizes to a compartment distinct from the cis-Golgi, in a tag-independent manner. (A) NRK cells were transfected with plasmids encoding Arf3-GFP, Arf3-mCherry, Arf3-HA, untagged Arf3, and/or GalT-GFP, as indicated. Fixed cells were stained for the specified markers, and images were acquired using a confocal microscope. Bar, 5 μm. (B) Quantitative analysis of signal overlap between Arf3 and the specified markers. Error bars, mean ± SD (n ≥ 16 cells from two separate experiments). (C) HeLa cells transfected with Arf3-GFP were prepared and examined by immuno-EM as described in Materials and Methods. Eighteen- and 12-nm gold particles correspond to GM130 and Arf3-GFP, respectively. Bar, 200 nm.
Figure 2.
Figure 2.
Arf3 recruitment involves BIGs but not GBF1. (A) HeLa cells were cotransfected with plasmids encoding Arf3-GFP and either BIG1 or GBF1. After 24 h, cells were treated with 5 μg/ml BFA for 2 min and then fixed and stained for BIG1 or GBF1. Epifluorescence images are shown. Small asterisks label the nucleus of transfected cells. Bar, 20 μm. (B) HeLa cells were transfected with a pool of siRNA duplexes targeting BIG1 and BIG2 (BIGs KD) for 72 h. Forty-eight hours before fixation, cells were cotransfected with Arf1-GFP and Arf3-mCherry plasmids. Fixed cells were stained for AP-1, and images were acquired using a confocal microscope. Small asterisks label the nucleus in a cell with efficient BIGs KD. Bar, 20 μm. (C) CHO and BFY1 cells were cotransfected with plasmids encoding Arf1-GFP and Arf3-mCherry. After 24 h, cells were treated with 5 μg/ml BFA for 2 min and then fixed. Representative epifluorescence images selected from at least two separate experiments are shown. Bar, 20 μm. (D) Quantitative analysis of cells overexpressing BIG1/GBF1 showing the percentage of cells with Arf3 localized to the Golgi complex after BFA treatment. Error bars, mean ± SD (n ≥ 30 cells from at least four separate experiments as in A). (E) Quantitative analysis of cells with Mock KD or BIGs KD showing the percentage of cells with Arf3 or Arf1 localized to the Golgi complex. Error bars, mean ± SD (n ≥ 30 cells from at least four separate experiments as in B).
Figure 3.
Figure 3.
Arf3 redistributes slowly between Golgi membranes and cytosol upon temperature shift to either 20 or 37°C. (A) HeLa cells were transfected with a plasmid encoding Arf3-GFP for 24 h. Cells were then shifted from 37 to 20°C (left) or kept at 20°C for 1 h and then shifted to 37°C (right). Cells were fixed at the indicated time after shift. Epifluorescence images are shown. Bar, 20 μm. (B) Quantitative analysis of Arf3 signal at the Golgi complex expressed as percent of total cell signal for temperature-shift experiments performed as in A (n ≥ 20 cells/time point from at least two separate experiments). (C) HeLa cells were transfected with a plasmid encoding FAPP-PH-YFP for 24 h. Cells were either fixed directly from 37°C (left) or shifted from 37 to 20°C (right) for either 30 min (FAPP-PH-YFP) or 2 h (AP-1) and then fixed. Cells were stained for AP-1 or not, and images were acquired using identical settings for the 37 and 20°C samples. Representative epifluorescence images selected from at least two separate experiments are shown. Bar, 20 μm.
Figure 4.
Figure 4.
The residue at position 13 in the N-terminal helix dictates the 20°C temperature sensitivity for membrane recruitment of Arf3 and Arf1. (A) Sequence alignment of N- and C-termini of Arf3 and Arf1 showing swapped regions (black line) and unique residues (bold). (B) Helical wheel representation of the N-terminal α-helix of Arf3 was obtained using DNA Strider 1.4f5. Variant amino acids present in Arf1 are shown on the outside at their respective positions. The N-terminal bound myristate is represented as a broken chain. The amino acid color code: yellow, hydrophobic; purple, serine; blue, basic; pink, asparagine; gray, alanine and glycine. (C) HeLa cells were transfected with either Arf313F-GFP or Arf113I-GFP constructs as indicated. After 24 h, cells were either kept at 37°C or shifted to 20°C for 30 min and then fixed. Epifluorescence images are shown. Schematic representation of each construct shown above each set of panels. Bar, 20 μm. (D) Quantitative analysis of Arf3-mutant signal at the Golgi complex expressed as percent of total cell signal for temperature-shift experiments performed as in C (n ≥ 6 cells/time point from at least two separate experiments).
Figure 5.
Figure 5.
Shift to 20°C, but not Arf3 KD, blocks VSVG traffic at the Golgi complex. (A) HeLa cells were transfected at t = 0 with either irrelevant siRNA (Mock KD, left), no RNA (middle), or a pool of two validated Arf3 siRNA duplexes (Arf3 KD, right); some cells were cotransfected with plasmid encoding Arf3FF (not shown). Fifty hours after transfection, cells were transfected again with a plasmid encoding VSVGts045-GFP. Temperature was shifted initially at 40°C for 4 h and then to either 32 or 20°C for the length of time specified. Epifluorescence images are shown. Bar, 5 μm. (B) HeLa cells were cotransfected with the indicated Arf3 siRNAs targeting Arf3 and 1 μg of plasmid encoding for Arf3-GFP for 24 h. Immunoblots of equal amounts of detergents lysates were probed with an anti-GFP antibody. Blots shown are representative of three separate experiments. (C) HeLa cells were transfected with the indicated siRNAs for 72 h. Immunoblots of equal amounts of detergents lysates were probed with an anti-Arf3 antibody. Blots shown are representative of two separate experiments. (D) Quantitative analysis showing percent of cells with VSVG in specified structures after release at the two different temperatures and time points. (E) Quantitative analysis showing percentage of cells with VSVG in specified structures after release at indicated time points in either Mock KD or Arf3 KD cells.
Figure 6.
Figure 6.
Two residues in the C-terminal helix are critical for the specific TGN localization of Arf3. (A) NRK cells were transfected with the indicated Arf3_1-GFP, Arf1_3-GFP, Arf3174S-GFP, Arf3178R-GFP or Arf3180Q-GFP constructs. After 24 h, cells were fixed and stained for p115 or BIG1. Images were acquired using a confocal microscope. Bar, 5 μm. (B and C) Quantitative analysis of experiments similar to A showing signal overlap between the Arf3/Arf1 swap chimeras or single mutants and the specified markers. Error bars, mean ± SD (n ≥ 10 cells from two separate experiments).
Figure 7.
Figure 7.
Arf3 evolved at least before the emergence of vertebrates. Phylogenetic analysis of class I Arf homologues rooted by the Monosiga brevicolis ArfI sequence. This tree shows the best Bayesian topology and support values for nodes with greater support than 0.80 posterior probability. Node values are given in the order of posterior probability values/PhyML bootstraps and RAxML bootstraps. Classification of Arfs with Roman numerals may reflect either the lack of resolution into an Arabic-numbered Arf clade or that they diverged before the duplications giving rise to that clade. The node supporting monophyly of proposed Arf3 homologues is shown in bold, and the clade is enclosed in the shaded box.
Figure 8.
Figure 8.
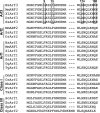
Sequence alignment of human, bovine, and other nonmammalian class I Arfs. Sequence alignment of the amino and carboxy termini of class I Arfs from representative species. These include species that express multiple class I Arfs such as H. sapiens (Hs), Mus musculus (Mm), Xenopus laevis (Xl), Danio rerio (Dr), Salmo salar (Ss), Gallus gallus (Gg), and Taeniopygia guttata (Tg). Also included are species that express a single class I Arf such as Drosophila melanogaster (Dm), Caenorhabditis elegans (Ce), Monosiga brevis (Mb), and N. vectensis (Nv). Widely used fungal model organisms such as Saccharomyces cerevisiae (Sc) and Schizosaccharomyces pombe (Sp) were included.

Similar articles

Cited by

References

    1. Abascal F., Zardoya R., Posada D. ProtTest: selection of best-fit models of protein evolution. Bioinformatics. 2005;21:2104–2105. - PubMed
    1. Allan V. J., Kreis T. E. A microtubule-binding protein associated with membranes of the Golgi apparatus. J. Cell Biol. 1986;103:2229–2239. - PMC - PubMed
    1. Antonny B., Beraud-Dufour S., Chardin P., Chabre M. N-terminal hydrophobic residues of the G-protein ADP-ribosylation factor-1 insert into membrane phospholipids upon GDP to GTP exchange. Biochemistry. 1997;36:4675–4684. - PubMed
    1. Bard F., Malhotra V. The formation of TGN-to-plasma-membrane transport carriers. Annu. Rev. Cell Dev. Biol. 2006;22:439–455. - PubMed
    1. Berger S. J., Claude A., Melançon P. Analysis of recombitant human ADP-ribosylation factors by reversed phase HPLC and Electrospray MS. Analyt. Biochem. 1998;264:53–65. - PubMed

Publication types

MeSH terms

LinkOut - more resources