

doi: 10.1016/j.cplett.2009.01.038.
An integrated model for enzyme catalysis emerges from studies of hydrogen tunneling
Affiliations
- PMID: 20354595
- PMCID: PMC2846846
- DOI: 10.1016/j.cplett.2009.01.038
Item in Clipboard
An integrated model for enzyme catalysis emerges from studies of hydrogen tunneling
Chem Phys Lett.
.
Abstract
The origins of the enormous rate accelerations brought about by enzymes are discussed. The focus is on enzymatic C-H activation, which has been shown to take place via tunneling. Four enzyme systems illustrate the impact of site-specific mutagenesis, changes in temperature or changes in protein solvation on the tunneling properties. A model emerges in which conformational sampling is required to access a subset of protein conformers where the H-donor and acceptor undergo a close approach. The evidence for an inverse relationship between protein flexibility and active site compression is likely to extend to all classes of enzyme catalysts.
Figures
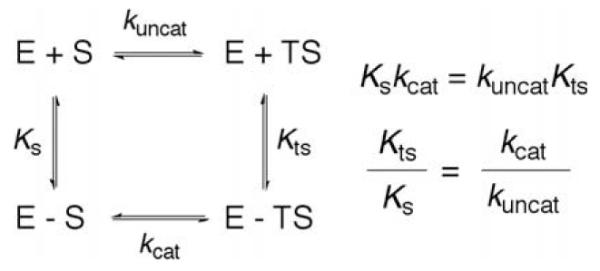
Thermodynamic box comparing the binding constants and rate constants for a non-enzymatic and enzymatic process. KS and KTS are the affinity of the substrate and transition state to enzyme. kuncat and kcat are the uncatalyzed and catalyzed rate constants.
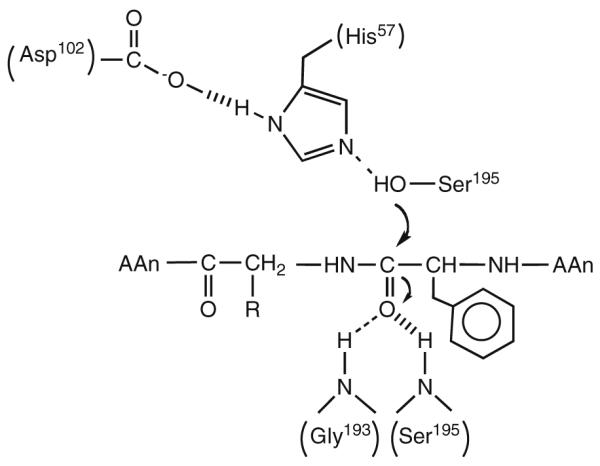
Schematic for the first chemical step in the reaction catalyzed by chymotrypsin. Five residues, Asp102, His57, Ser195, Gly193, and Ser195, are shown participating in the reaction.
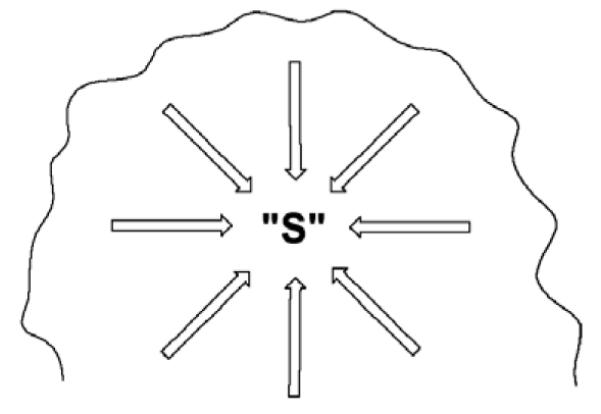
Schematic of an enzyme active site, where each arrow represents one of the enzyme-substrate interactions that must be achieved simultaneously for effective catalysis to ensue. These interactions will encompass specific hydrogen bonds, electrostatic interactions, pi-stacking, etc.
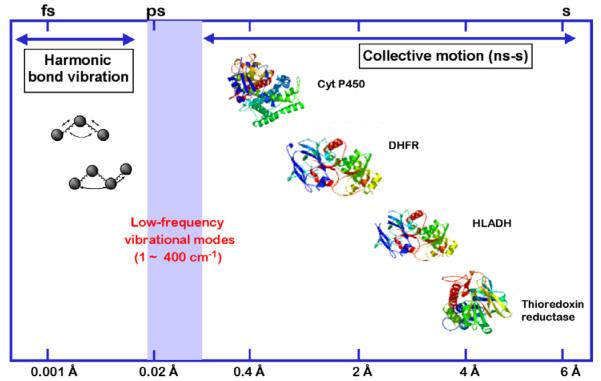
Different classes of motions that can contribute to catalysis. The collective motions may be quite slow and involve large amplitude changes, as illustrated for experimentally demonstrated domain and loop closures within cytochrome P450 (Cyt P450), dihydrofolate reductase (DHFR), horse liver alcohol dehydrogenase (HLADH), and thioredoxin reductase. The faster motions in the nsec to fs are expected to occur ‘locally’ and over much smaller distances. A major goal has been to understand the contribution of the fast and slow motions to the bond cleavage events catalyzed by enzymes. From Ref. [10].
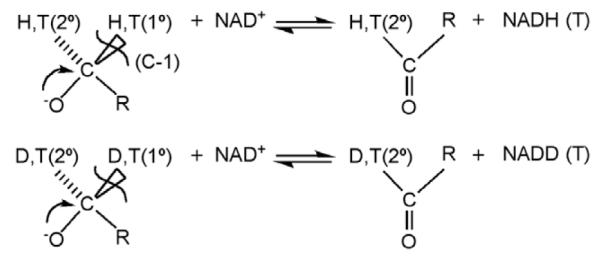
Studies of the oxidation of alcohols catalyzed by alcohol dehydrogenases. Substrate is labeled with either protium and tritium or deuterium and tritium at both the primary (1°) and secondary (2°) positions.
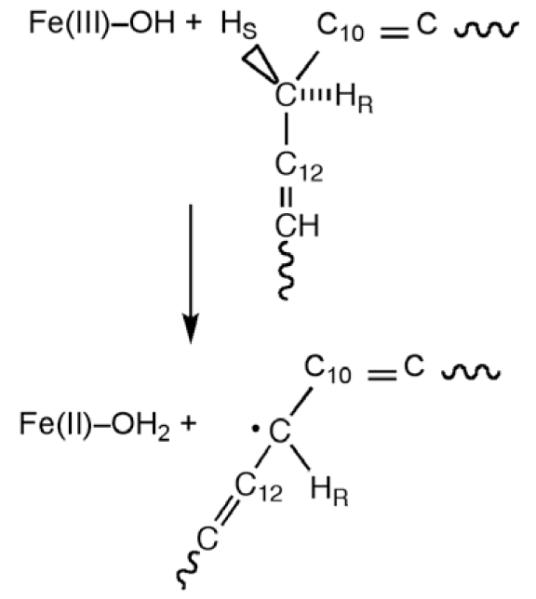
Reaction catalyzed by SLO, in which a hydrogen atom is removed from the C-11 of substrate, transferring an electron to the Fe3+ center and a proton to the hydroxide ion bound to the iron.
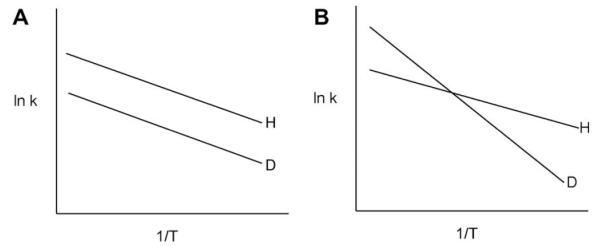
Isotope effects on Arrhenius plots in which (A) the energy of activation for C–D cleavage is the same as for C–H cleavage; or (B) the energy of activation for C–D cleavage greatly exceeds that for C–H cleavage. Neither behavior in this figure is compatible with the semi-classical theory for hydrogen transfer.
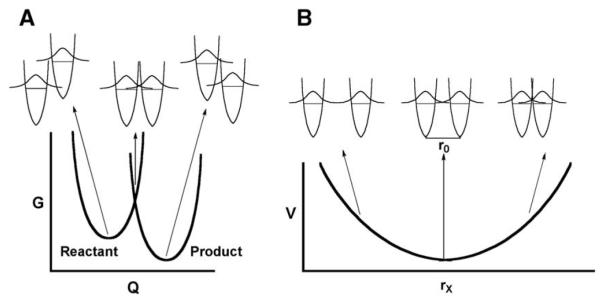
Schematic representation of two coordinates for heavy atom motion that contribute to hydrogen tunneling. The coordinate in (A) represents the energy barrier to bring the H-donor and acceptor into transient degeneracy, while the coordinate in (B) represents the energy barrier to bring H-donor and acceptor to a close enough distance for tunneling to occur.
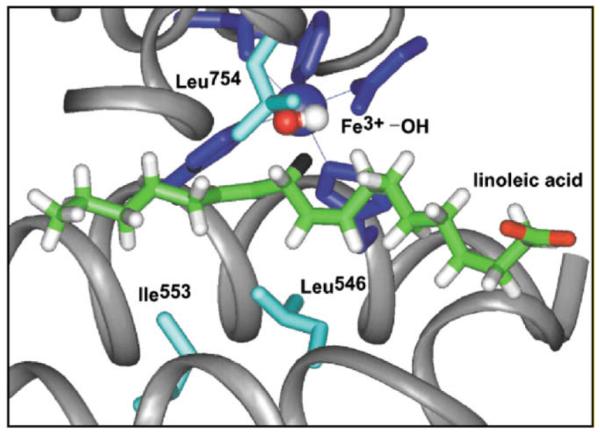
Active site structure for SLO-1 derived from X-ray crystallography [83,84]. The substrate linoleic acid has been modeled into the active site as previously described [34]. The hydrogen at position II of substrate is colored black.
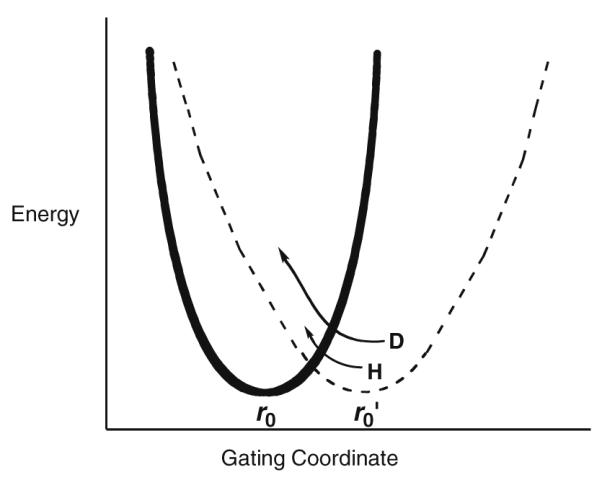
Illustration of the gating coordinate treated as a harmonic oscillator with different values for ωx. The solid line represents the wild-type protein with a crowded active site (small r0) and high frequency for distance sampling. Mutation is expected to lengthen the distance between reactants (larger r0) and to decrease the frequency of the gating coordinate. Note the r0 represents distance within the active site configurations that lead to tunneling, by necessity shorter than the van der Waals distances observed, for example, by X-ray crystallography.
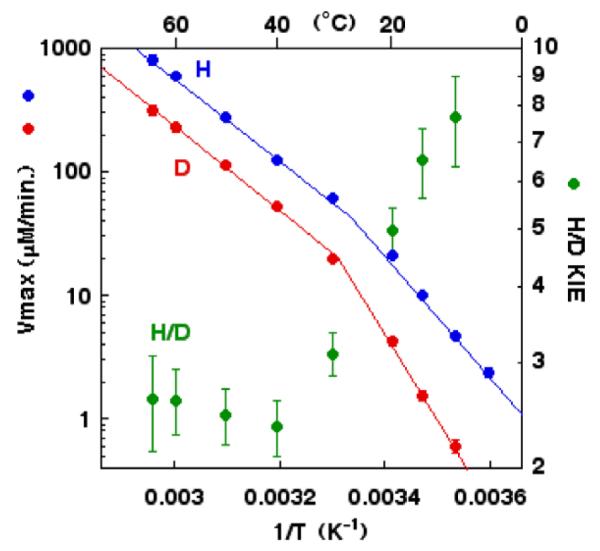
Temperature dependence of the rate of catalysis ( , D and
  , H) and of the H/D KIE (
 ) for the ht-ADH.
, D and , H) and of the H/D KIE () for the ht-ADH.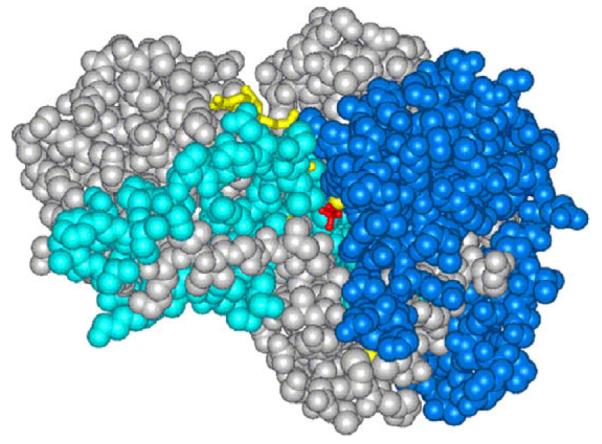
Representation of the structure for ht-ADH, with the regions in cyan indicating the increased flexibility in the cofactor domain above 40 °C and the regions in royal blue representing the increase in flexibility in the substrate domain above 20 °C. Note that these appear as discrete regions of protein that connect the solvent surface to the active site.
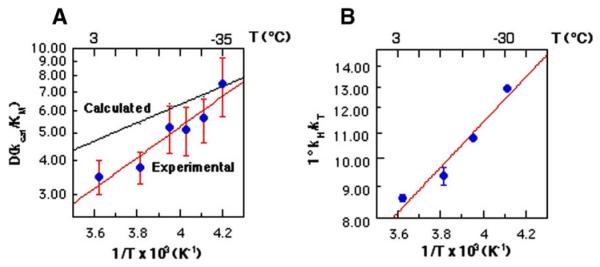
Temperature dependence of the KIE at sub-zero temperatures for F93W HLADH. (A) is a plot of the measured D(kcat/Km) vs. the reciprocal of temperature, with the more shallow (calculated) line representing the expected change in the KIE on the basis of semi-classical considerations. (B) is a plot of the experimental tritium isotope effect, T(kcat/Km) as a function of temperature [58].
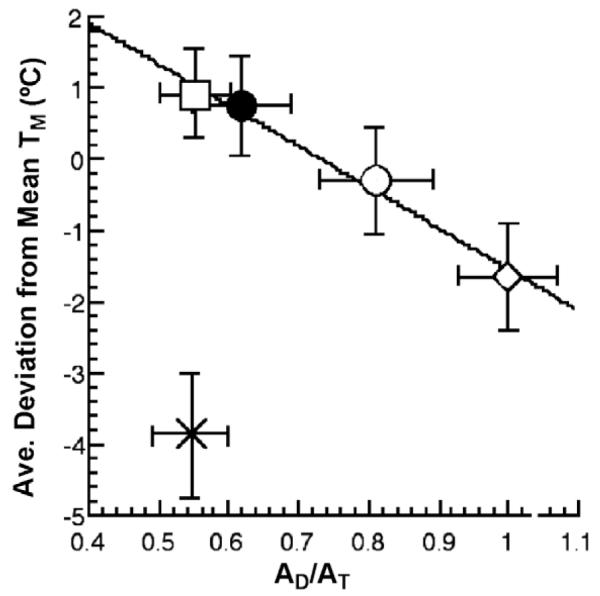
A plot of the average deviation from the mean melting temperature, Tm, of the individual Tm values for □ (PEG5000), ● (Rec320), ○ (Deglycosylated Rec320), ◇ (Wild-type enzyme), and × (PEG350) surface variants of GO [26].
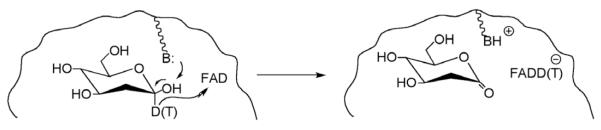
Reaction studied in the glucose oxidase reaction, in which the reactive carbon at C-1 of 2′-deoxyglucose has been labeled with deuterium and tritium. The hydride ion from C-1 is transferred to the flavin cofactor (FAD).
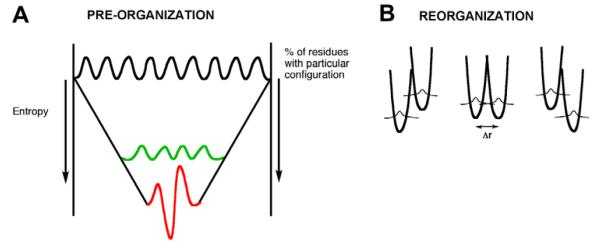
(A) A funnel is used to represent the conformational sampling referred to as pre-organization. The top of the funnel represents 100% of the possible enzyme conformations that lead to one of the requisite interactions for catalysis. The probability of achieving the large number of interactions necessary for efficient catalysis is found further down the funnel with a reduced probability or entropy (green band). Freezing out of conformational sampling, as occurs for thermophilic proteins operating at a reduced temperature, is shown by the red band. In order to function at this reduced temperature, the protein must first increase its flexibility, represented as an increase in TΔS‡. (B) The coordinates designated reorganization (Fig. 2), have been consolidated into a single diagram that allows for protein reorganization to achieve the respective energy levels and inter-nuclear distances needed for tunneling.
Similar articles
-
Understanding Biological Hydrogen Transfer Through the Lens of Temperature Dependent Kinetic Isotope Effects.Acc Chem Res. 2018 Sep 18;51(9):1966-1974. doi: 10.1021/acs.accounts.8b00226. Epub 2018 Aug 28. Acc Chem Res. 2018. PMID: 30152685 Free PMC article. Review.
-
Extremely elevated room-temperature kinetic isotope effects quantify the critical role of barrier width in enzymatic C-H activation.J Am Chem Soc. 2014 Jun 11;136(23):8157-60. doi: 10.1021/ja502726s. Epub 2014 Jun 2. J Am Chem Soc. 2014. PMID: 24884374 Free PMC article.
-
The role of tunneling in enzyme catalysis of C-H activation.Biochim Biophys Acta. 2006 Aug;1757(8):981-7. doi: 10.1016/j.bbabio.2005.12.004. Epub 2006 Feb 8. Biochim Biophys Acta. 2006. PMID: 16546116 Review.
-
13C ENDOR Spectroscopy of Lipoxygenase-Substrate Complexes Reveals the Structural Basis for C-H Activation by Tunneling.J Am Chem Soc. 2017 Feb 8;139(5):1984-1997. doi: 10.1021/jacs.6b11856. Epub 2017 Jan 25. J Am Chem Soc. 2017. PMID: 28121140 Free PMC article.
-
Dynamically achieved active site precision in enzyme catalysis.Acc Chem Res. 2015 Feb 17;48(2):449-56. doi: 10.1021/ar5003347. Epub 2014 Dec 24. Acc Chem Res. 2015. PMID: 25539048 Free PMC article. Review.
Cited by
-
Determinants of Photolyase's DNA Repair Mechanism in Mesophiles and Extremophiles.J Am Chem Soc. 2018 Feb 28;140(8):2853-2861. doi: 10.1021/jacs.7b11926. Epub 2018 Feb 13. J Am Chem Soc. 2018. PMID: 29401372 Free PMC article.
-
Submillisecond mixing in a continuous-flow, microfluidic mixer utilizing mid-infrared hyperspectral imaging detection.Lab Chip. 2014 Feb 7;14(3):584-91. doi: 10.1039/c3lc51171e. Lab Chip. 2014. PMID: 24302515 Free PMC article.
-
Enzymatic methyl transfer: role of an active site residue in generating active site compaction that correlates with catalytic efficiency.J Am Chem Soc. 2011 Nov 2;133(43):17134-7. doi: 10.1021/ja207467d. Epub 2011 Oct 10. J Am Chem Soc. 2011. PMID: 21958159 Free PMC article.
-
Computational identification of slow conformational fluctuations in proteins.J Phys Chem B. 2009 Dec 31;113(52):16669-80. doi: 10.1021/jp9077213. J Phys Chem B. 2009. PMID: 19908896 Free PMC article.
-
Enzymatic transition states and dynamic motion in barrier crossing.Nat Chem Biol. 2009 Aug;5(8):551-8. doi: 10.1038/nchembio.202. Nat Chem Biol. 2009. PMID: 19620996 Free PMC article.
References
-
- Wolfenden R, Snider MJ. Acc. Chem. Res. 2001;34:938. - PubMed
-
- Dwyer MA, Looger LL, Hellinga HW. Science. 2008;319:569. - PubMed
-
- Jiang L, et al. Science. 2005;309:1868. - PubMed
-
- Pauling L. Am. Sci. 1948;36:51. - PubMed
-
- Wolfenden R. In: Transition States of Biochemical Processes. Gandour RD, Schowen RL, editors. Plenum Press; New York and London: 1978. p. 558.
Grants and funding
LinkOut - more resources
Full Text Sources
Other Literature Sources