Differential expression of the circadian clock in maternal and embryonic tissues of mice
- PMID: 20352049
- PMCID: PMC2844431
- DOI: 10.1371/journal.pone.0009855
Differential expression of the circadian clock in maternal and embryonic tissues of mice
Abstract
Background: Molecular feedback loops involving transcription and translation and several key genes are at the core of circadian regulatory cycles affecting cellular pathways and metabolism. These cycles are active in most adult animal cells but little is known about their expression or influence during development.
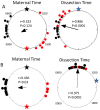
Methodology/principal findings: To determine if circadian cycles are active during mammalian development we measured the expression of key circadian genes during embryogenesis in mice using quantitative real-time RT-PCR. All of the genes examined were expressed in whole embryos beginning at the earliest age examined, embryonic day 10. In contrast to adult tissues, circadian variation was absent for all genes at all of the embryonic ages examined in either whole embryos or individual tissues. Using a bioluminescent fusion protein that tracks translation of the circadian gene, per2, we also analyzed protein levels. Similar to mRNA, a protein rhythm was observed in adult tissue but not in embryonic tissues collected in-vivo. In contrast, when tissues were placed in culture for the continuous assay of bioluminescence, rhythms were observed in embryonic (E18) tissues. We found that placing embryonic tissues in culture set the timing (phase) of these rhythms, suggesting the importance of a synchronizing signal for the expression of circadian cycles in developing tissues.
Conclusions/significance: These results show that embryonic tissues express key circadian genes and have the capacity to express active circadian regulatory cycles. In vivo, circadian cycles are not expressed in embryonic tissues as they are in adult tissues. Individual cells might express oscillations, but are not synchronized until later in development.
Conflict of interest statement
Figures


Similar articles
-
Embryonic development and maternal regulation of murine circadian clock function.Chronobiol Int. 2015 Apr;32(3):416-27. doi: 10.3109/07420528.2014.986576. Epub 2014 Nov 28. Chronobiol Int. 2015. PMID: 25431080
-
Circadian genes are expressed during early development in Xenopus laevis.PLoS One. 2008 Jul 23;3(7):e2749. doi: 10.1371/journal.pone.0002749. PLoS One. 2008. PMID: 18716681 Free PMC article.
-
Chronobiological analysis of circadian patterns in transcription of seven key clock genes in six peripheral tissues in mice.Chronobiol Int. 2007;24(5):793-820. doi: 10.1080/07420520701672556. Chronobiol Int. 2007. PMID: 17994338
-
Circadian clocks during embryonic and fetal development.Birth Defects Res C Embryo Today. 2007 Sep;81(3):204-14. doi: 10.1002/bdrc.20101. Birth Defects Res C Embryo Today. 2007. PMID: 17963275 Review.
-
Genetics and molecular biology of rhythms in Drosophila and other insects.Adv Genet. 2003;48:1-280. doi: 10.1016/s0065-2660(03)48000-0. Adv Genet. 2003. PMID: 12593455 Review.
Cited by
-
Time of day dependent changes in embryonic heart rate are detectable after maturation of rhythmic circadian gene expression in the eye, but before the heart in Xenopus laevis tadpoles cultured in LD.MicroPubl Biol. 2024 Sep 3;2024:10.17912/micropub.biology.001277. doi: 10.17912/micropub.biology.001277. eCollection 2024. MicroPubl Biol. 2024. PMID: 39291148 Free PMC article.
-
Effects of the neonatal intensive care environment on circadian health and development of preterm infants.Front Physiol. 2023 Aug 31;14:1243162. doi: 10.3389/fphys.2023.1243162. eCollection 2023. Front Physiol. 2023. PMID: 37719464 Free PMC article. Review.
-
Circadian Regulation of the Neuroimmune Environment Across the Lifespan: From Brain Development to Aging.J Biol Rhythms. 2023 Oct;38(5):419-446. doi: 10.1177/07487304231178950. Epub 2023 Jun 26. J Biol Rhythms. 2023. PMID: 37357738 Free PMC article. Review.
-
Melatonin in Health and Disease: A Perspective for Livestock Production.Biomolecules. 2023 Mar 7;13(3):490. doi: 10.3390/biom13030490. Biomolecules. 2023. PMID: 36979425 Free PMC article. Review.
-
Development of the circadian system in early life: maternal and environmental factors.J Physiol Anthropol. 2022 May 16;41(1):22. doi: 10.1186/s40101-022-00294-0. J Physiol Anthropol. 2022. PMID: 35578354 Free PMC article. Review.
References
-
- Johnson MH, Day ML. Egg timers: how is developmental time measured in the early vertebrate embryo? BioEssays. 2000;1:57–63. - PubMed
-
- Rougvie AE. Intrinsic and extrinsic regulators of developmental timing: from miRNAs to nutritional cues. Development. 2005;132:3787–3798. - PubMed
-
- Lewis J. From signals to patterns: space, time, and mathematics in developmental biology. Science. 2008;322:399–403. - PubMed
-
- Whitmore D, Foulkes NS, Sassone-Corsi P. Light acts directly on organs and cells in culture to set the vertebrate circadian clock. Nature. 2000;404:87–91. - PubMed
-
- Plautz JD, Kaneko M, Hall JC, Kay SA. Independent photoreceptive circadian clocks throughout Drosophila. Science. 1997;278:1632–1635. - PubMed
Publication types
MeSH terms
Grants and funding
LinkOut - more resources
Full Text Sources
Other Literature Sources
Molecular Biology Databases

