Molecular characterization of mutant Arabidopsis plants with reduced plasma membrane proton pump activity
- PMID: 20348108
- PMCID: PMC2878554
- DOI: 10.1074/jbc.M110.101733
Molecular characterization of mutant Arabidopsis plants with reduced plasma membrane proton pump activity
Abstract
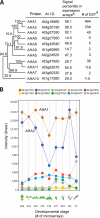
Arabidopsis mutants containing gene disruptions in AHA1 and AHA2, the two most highly expressed isoforms of the Arabidopsis plasma membrane H(+)-ATPase family, have been isolated and characterized. Plants containing homozygous loss-of-function mutations in either gene grew normally under laboratory conditions. Transcriptome and mass spectrometric measurements demonstrate that lack of lethality in the single gene mutations is not associated with compensation by increases in RNA or protein levels. Selected reaction monitoring using synthetic heavy isotope-labeled C-terminal tryptic peptides as spiked standards with a triple quadrupole mass spectrometer revealed increased levels of phosphorylation of a regulatory threonine residue in both isoforms in the mutants. Using an extracellular pH assay as a measure of in vivo ATPase activity in roots, less proton secreting activity was found in the aha2 mutant. Among 100 different growth conditions, those that decrease the membrane potential (high external potassium) or pH gradient (high external pH) caused a reduction in growth of the aha2 mutant compared with wild type. Despite the normal appearance of single mutants under ideal laboratory growth conditions, embryos containing homozygous double mutations are lethal, demonstrating that, as expected, this protein is absolutely essential for plant cell function. In conclusion, our results demonstrate that the two genes together perform an essential function and that the effects of their single mutations are mostly masked by overlapping patterns of expression and redundant function as well as by compensation at the post-translational level.
Figures


Similar articles
-
The effect of a genetically reduced plasma membrane protonmotive force on vegetative growth of Arabidopsis.Plant Physiol. 2012 Mar;158(3):1158-71. doi: 10.1104/pp.111.189167. Epub 2012 Jan 3. Plant Physiol. 2012. PMID: 22214817 Free PMC article.
-
Roles of plasma membrane proton ATPases AHA2 and AHA7 in normal growth of roots and root hairs in Arabidopsis thaliana.Physiol Plant. 2019 Jul;166(3):848-861. doi: 10.1111/ppl.12842. Epub 2018 Nov 20. Physiol Plant. 2019. PMID: 30238999 Free PMC article.
-
Arabidopsis plasma membrane H+-ATPase genes AHA2 and AHA7 have distinct and overlapping roles in the modulation of root tip H+ efflux in response to low-phosphorus stress.J Exp Bot. 2017 Mar 1;68(7):1731-1741. doi: 10.1093/jxb/erx040. J Exp Bot. 2017. PMID: 28369625 Free PMC article.
-
Regulation of the plasma membrane proton pump (H(+)-ATPase) by phosphorylation.Curr Opin Plant Biol. 2015 Dec;28:68-75. doi: 10.1016/j.pbi.2015.09.005. Epub 2015 Oct 24. Curr Opin Plant Biol. 2015. PMID: 26476298 Free PMC article. Review.
-
Regulation of plasma membrane H(+)-ATPase in fungi and plants.Biochim Biophys Acta. 2000 Mar 10;1469(1):31-42. doi: 10.1016/s0304-4157(99)00011-8. Biochim Biophys Acta. 2000. PMID: 10692636 Review.
Cited by
-
A Munc13-like protein in Arabidopsis mediates H+-ATPase translocation that is essential for stomatal responses.Nat Commun. 2013;4:2215. doi: 10.1038/ncomms3215. Nat Commun. 2013. PMID: 23896897 Free PMC article.
-
A peptide hormone and its receptor protein kinase regulate plant cell expansion.Science. 2014 Jan 24;343(6169):408-11. doi: 10.1126/science.1244454. Science. 2014. PMID: 24458638 Free PMC article.
-
Analysis of tomato plasma membrane H(+)-ATPase gene family suggests a mycorrhiza-mediated regulatory mechanism conserved in diverse plant species.Mycorrhiza. 2016 Oct;26(7):645-56. doi: 10.1007/s00572-016-0700-9. Epub 2016 Apr 22. Mycorrhiza. 2016. PMID: 27103309
-
Role of Arabidopsis RAB5 GEF vps9a in maintaining potassium levels under sodium chloride stress.Plant Direct. 2020 Oct 21;4(10):e00273. doi: 10.1002/pld3.273. eCollection 2020 Oct. Plant Direct. 2020. PMID: 33103044 Free PMC article.
-
The role of the plasma membrane H+-ATPase in plant-microbe interactions.Mol Plant. 2011 May;4(3):416-27. doi: 10.1093/mp/ssq083. Epub 2011 Feb 7. Mol Plant. 2011. PMID: 21300757 Free PMC article. Review.
References
-
- Lingrel J. B., Williams M. T., Vorhees C. V., Moseley A. E. (2007) J. Bioenerg. Biomembr. 39, 385–389 - PubMed
-
- de Carvalho Aguiar P., Sweadner K. J., Penniston J. T., Zaremba J., Liu L., Caton M., Linazasoro G., Borg M., Tijssen M. A., Bressman S. B., Dobyns W. B., Brashear A., Ozelius L. J. (2004) Neuron 43, 169–175 - PubMed
-
- Serrano R., Kielland-Brandt M. C., Fink G. R. (1986) Nature 319, 689–693 - PubMed
Publication types
MeSH terms
Substances
LinkOut - more resources
Full Text Sources
Other Literature Sources
Molecular Biology Databases

