Insertional translocation detected using FISH confirmation of array-comparative genomic hybridization (aCGH) results
- PMID: 20340098
- PMCID: PMC3726029
- DOI: 10.1002/ajmg.a.33278
Insertional translocation detected using FISH confirmation of array-comparative genomic hybridization (aCGH) results
Abstract
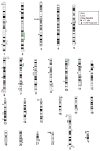
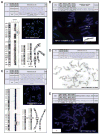
Insertional translocations (ITs) are rare events that require at least three breaks in the chromosomes involved and thus qualify as complex chromosomal rearrangements (CCR). In the current study, we identified 40 ITs from approximately 18,000 clinical cases (1:500) using array-comparative genomic hybridization (aCGH) in conjunction with fluorescence in situ hybridization (FISH) confirmation of the aCGH findings, and parental follow-up studies. Both submicroscopic and microscopically visible IT events were detected. They were divided into three major categories: (1) simple intrachromosomal and interchromosomal IT resulting in pure segmental trisomy, (2) complex IT involving more than one abnormality, (3) deletion inherited from a parent with a balanced IT resulting in pure segmental monosomy. Of the cases in which follow-up parental studies were available, over half showed inheritance from an apparently unaffected parent carrying the same unbalanced rearrangement detected in the propositi, thus decreasing the likelihood that these IT events are clinically relevant. Nevertheless, we identified six cases in which small submicroscopic events were detected involving known disease-associated genes/genomic segments and are likely to be pathogenic. We recommend that copy number gains detected by clinical aCGH analysis should be confirmed using FISH analysis whenever possible in order to determine the physical location of the duplicated segment. We hypothesize that the increased use of aCGH in the clinic will demonstrate that IT occurs more frequently than previously considered but can identify genomic rearrangements with unclear clinical significance.
Copyright 2010 Wiley-Liss, Inc.
Figures


Similar articles
-
[Chromosomal location of submicroscopic duplications in patients with neurodevelopmental disorders to identify cases with high risk of familial recurrence].Med Clin (Barc). 2014 Jun 16;142(12):531-7. doi: 10.1016/j.medcli.2013.04.034. Epub 2013 Jun 20. Med Clin (Barc). 2014. PMID: 23790573 Spanish.
-
Use of Array Comparative Genomic Hybridization for the Diagnosis of DiGeorge Syndrome in Saudi Arabian Population.Cytogenet Genome Res. 2018;154(1):20-29. doi: 10.1159/000487094. Epub 2018 Feb 17. Cytogenet Genome Res. 2018. PMID: 29455205
-
Autosomal insertional translocation mimicking an X-linked mode of inheritance.Eur J Med Genet. 2013 Jan;56(1):46-9. doi: 10.1016/j.ejmg.2012.10.006. Epub 2012 Oct 26. Eur J Med Genet. 2013. PMID: 23107885
-
Molecular characterization of a patient with 3p deletion syndrome and a review of the literature.Am J Med Genet A. 2008 Nov 1;146A(21):2746-52. doi: 10.1002/ajmg.a.32533. Am J Med Genet A. 2008. PMID: 18837054 Review.
-
Applications of array comparative genomic hybridization in obstetrics.Obstet Gynecol Clin North Am. 2010 Mar;37(1):71-85, Table of Contents. doi: 10.1016/j.ogc.2010.02.001. Obstet Gynecol Clin North Am. 2010. PMID: 20494259 Review.
Cited by
-
Methods of Detection and Mechanisms of Origin of Complex Structural Genome Variations.Methods Mol Biol. 2024;2825:39-65. doi: 10.1007/978-1-0716-3946-7_2. Methods Mol Biol. 2024. PMID: 38913302 Review.
-
Large genomic insertion at the Shh locus results in hammer toes through enhancer adoption.Proc Natl Acad Sci U S A. 2018 Jan 30;115(5):839-841. doi: 10.1073/pnas.1721351115. Epub 2018 Jan 12. Proc Natl Acad Sci U S A. 2018. PMID: 29330329 Free PMC article. No abstract available.
-
Mechanisms for Complex Chromosomal Insertions.PLoS Genet. 2016 Nov 23;12(11):e1006446. doi: 10.1371/journal.pgen.1006446. eCollection 2016 Nov. PLoS Genet. 2016. PMID: 27880765 Free PMC article.
-
Deciphering the complexity of simple chromosomal insertions by genome sequencing.Hum Genet. 2021 Feb;140(2):361-380. doi: 10.1007/s00439-020-02210-x. Epub 2020 Jul 29. Hum Genet. 2021. PMID: 32728808
-
Familial Infertility (Azoospermia and Cryptozoospermia) in Two Brothers-Carriers of t(1;7) Complex Chromosomal Rearrangement (CCR): Molecular Cytogenetic Analysis.Int J Mol Sci. 2020 Jun 26;21(12):4559. doi: 10.3390/ijms21124559. Int J Mol Sci. 2020. PMID: 32604929 Free PMC article.
References
-
- Arens YH, Engelen JJ, Govaerts LC, van Ravenswaay CM, Loneus WH, van Lent-Albrechts JC, van der Blij-Philipsen M, Hamers AJ, Schrander-Stumpel CT. Familial insertion (3;5)(q25.3;q22.1q31.3) with deletion or duplication of chromosome region 5q22.1–5q31.3 in ten unbalanced carriers. Am J Med Genet Part A. 2004;130A:128–133. - PubMed
-
- Bi W, Sapir T, Shchelochkov OA, Zhang F, Withers MA, Hunter JV, Levy T, Shinder V, Peiffer DA, Gunderson KL, Nezarati MM, Shotts VA, Amato SS, Savage SK, Harris DJ, Day-Salvatore DL, Horner M, Lu XY, Sahoo T, Yanagawa Y, Beaudet AL, Cheung SW, Martinez S, Lupski JR, Reiner O. Increased LIS1 expression affects human and mouse brain development. Nat Genet. 2009;41:168–177. - PMC - PubMed
-
- Brunetti-Pierri N, Berg JS, Scaglia F, Belmont J, Bacino CA, Sahoo T, Lalani SR, Graham B, Lee B, Shinawi M, Shen J, Kang SH, Pursley A, Lotze T, Kennedy G, Lansky-Shafer S, Weaver C, Roeder ER, Grebe TA, Arnold GL, Hutchison T, Reimschisel T, Amato S, Geragthy MT, Innis JW, Obersztyn E, Nowakowska B, Rosengren SS, Bader PI, Grange DK, Naqvi S, Garnica AD, Bernes SM, Fong CT, Summers A, Walters WD, Lupski JR, Stankiewicz P, Cheung SW, Patel A. Recurrent reciprocal 1q21.1 deletions and duplications associated with microcephaly or macrocephaly and developmental and behavioral abnormalities. Nat Genet. 2008;40:1466–1471. - PMC - PubMed
-
- Carvalho CMB, Zhang F, Liu P, Patel A, Sahoo T, Bacino CA, Shaw C, Peacock S, Pursley A, Tavyev YJ, Ramocki MB, Nawara M, Obersztyn E, Vianna-Morgante AM, Stankiewicz P, Zoghbi HY, Cheung SW, Lupski JR. Complex rearrangements in patients with duplications of MECP2 can occur by Fork Stalling and template switching. Hum Mol Genet. 2009;18:2188–2203. - PMC - PubMed
MeSH terms
Grants and funding
LinkOut - more resources
Full Text Sources

