. 2010 Mar 22;5(3):e9808.
doi: 10.1371/journal.pone.0009808.

A role for fibrillar collagen deposition and the collagen internalization receptor endo180 in glioma invasion

Affiliations

A role for fibrillar collagen deposition and the collagen internalization receptor endo180 in glioma invasion

Ivo J Huijbers et al. PLoS One. .

Abstract

Background: Glioblastoma multiforme (GBM, WHO grade IV) is the most common and most malignant of astrocytic brain tumors, and is associated with rapid invasion into neighboring tissue. In other tumor types it is well established that such invasion involves a complex interaction between tumor cells and locally produced extracellular matrix. In GBMs, surprisingly little is known about the associated matrix components, in particular the fibrillar proteins such as collagens that are known to play a key role in the invasion of other tumor types.

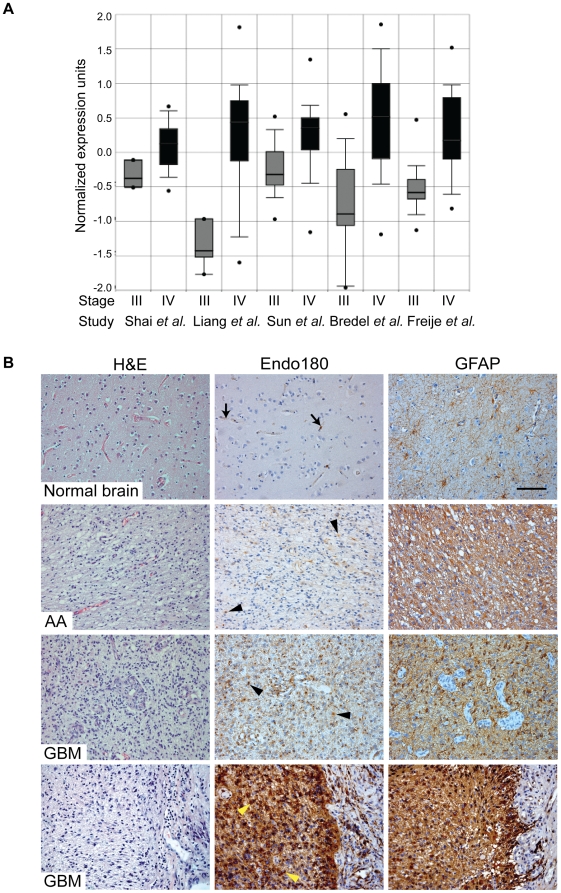
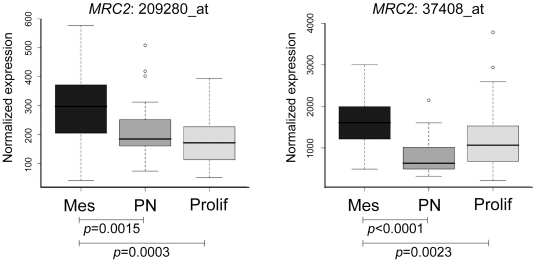
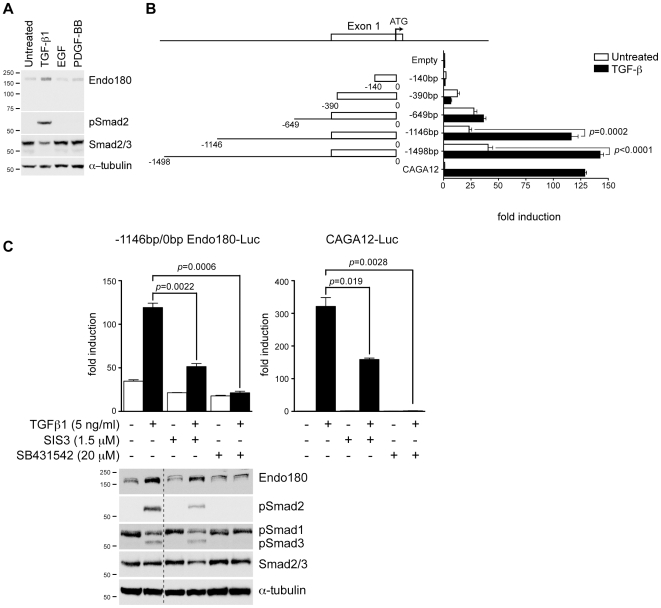
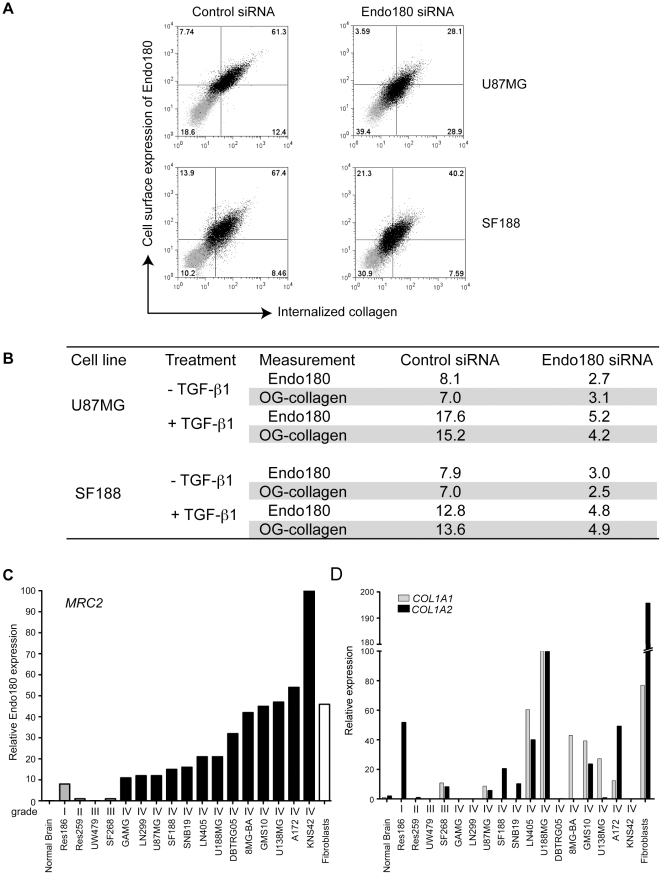
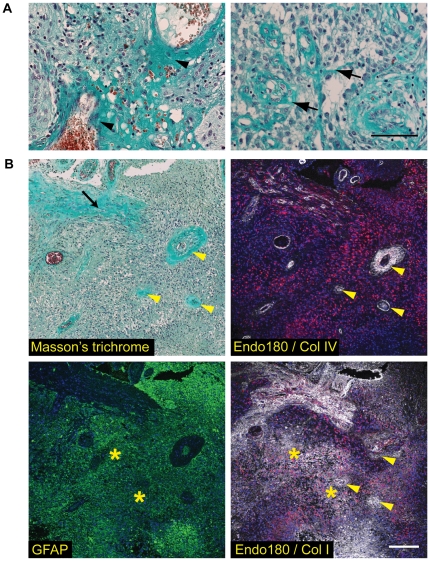
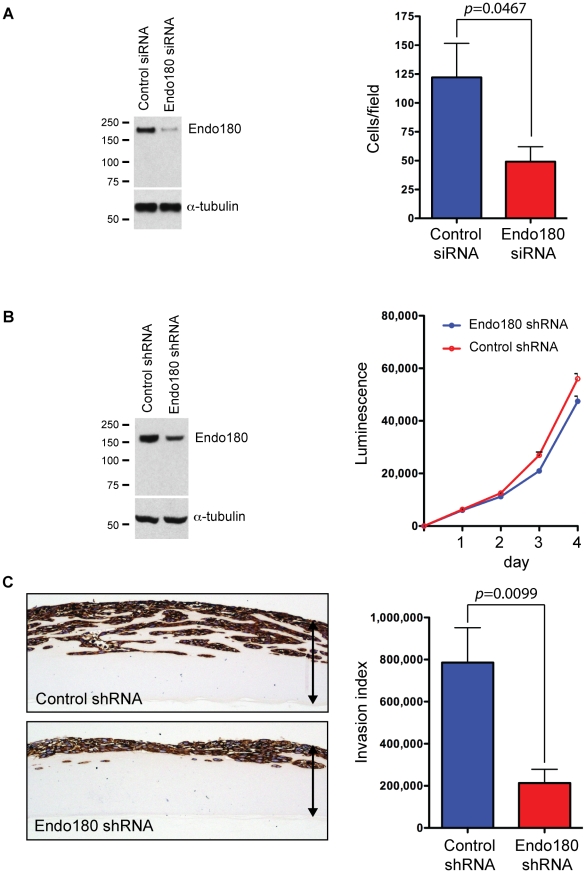
Methodology/principal findings: In this study we have used both the Masson's trichrome staining and a high resolution multiple immunofluorescence labeling method to demonstrate that intratumoral fibrillar collagens are an integral part of the extracellular matrix in a subset of GBMs. Correlated with this collagen deposition we observed high level expression of the collagen-binding receptor Endo180 (CD280) in the tumor cells. Further, interrogation of multiple expression array datasets identified Endo180 as one of the most highly upregulated transcripts in grade IV GBMs compared to grade III gliomas. Using promoter analysis studies we show that this increased expression is, in part, mediated via TGF-beta signaling. Functionally, we demonstrate that Endo180 serves as the major collagen internalization receptor in GBM cell lines and provide the first evidence that this activity is critical for the invasion of GBM cells through fibrillar collagen matrices.

Conclusions/significance: This study demonstrates, for the first time, that fibrillar collagens are extensively deposited in GBMs and that the collagen internalization receptor Endo180 is both highly expressed in these tumors and that it serves to mediate the invasion of tumor cells through collagen-containing matrices. Together these data provide important insights into the mechanism of GBM invasion and identify Endo180 as a potential target to limit matrix turnover by glioma cells and thereby restrict tumor progression.


Conflict of interest statement

Competing Interests: The authors have declared that no competing interests exist.

Figures

Figure 1
Figure 1. Endo180 expression is highly upregulated in GBMs.
(A) Normalized expression of Endo180 in grade III gliomas (astrocytomas, oligodendrogliomas and oligoastrocytomas) and grade IV gliomas (GBMs). Box plots were created by ONCOMINE™ from five independent expression array studies. p-values were 5.6×10⁻⁵ (Shai et al.) , 1×10⁻⁶ (Liang et al.) , 2.2×10⁻¹² (Sun et al.) , 5.9×10⁻⁸ (Bredel et al.) and 2.3×10⁻¹² (Freije et al.) . (B) FFPE whole tissue sections of normal brain (2 samples) and grade III (2 samples) or grade IV gliomas (9 samples) were H&E stained or immunostained for Endo180 (mAb 39.10) and glial fibrillary acidic protein (GFAP). Representative images of the temporal lobe of normal brain showing weak expression of Endo180 in some cells associated with the vasculature (arrows); a grade III anaplastic astrocytoma (AA) showing weak Endo180 expression in GFAP-positive tumor cells (arrowheads), two grade IV glioblastomas (GBM) showing strong Endo180 expression in tumor cells (black and yellow arrowheads). Scale bar, 100 µm.
Figure 2
Figure 2. Endo180 expression is associated with the ‘mesenchymal’ subclass of high grade glioma.
Boxplots for Endo180 (MRC2) expression values in the three molecular subclasses of high-grade glioma described by expression profiling : mesenchymal (Mes), proneural (PN) and proliferative (Prolif). The two MRC2 probe sets, 209280_at and 37408_at, that were present in the array are significantly associated with the mesenchymal group of tumors (Mann-Whitney U test). Box represents upper and lower quartiles, with median designated by a horizontal line. Whiskers represent the minimum and maximum non-outlier observations, with outliers (open circles) defined as having a value more than 1.5 times the interquartile range lower than the first quartile, or higher than the third quartile.
Figure 3
Figure 3. Expression of Endo180 is regulated by TGF-β signaling.
(A) U87MG cells were stimulated for 24 h with 5 ng/ml TGF-β1, 50 ng/ml EGF or 50 ng/ml PDGF-BB. Endo180 expression (mAb A5/158) and phosphorylation of the SMAD2 protein was monitored by western blotting. (B) Schematic diagram showing the Endo180 promoter fragments cloned into pGL3-basic. U87MG cells were transfected with Endo180 promoter constructs or control vectors, pGL3-empty and pGL3-CAGA12-Luc, and treated with or without 5 ng/ml TGF-β1 for 24 h. Bars represent mean values from three independent experiments ± SEM. p-values were generated using the student's t-test. (C) The −1146bp/0bp Endo180 promoter construct or the pGL3-CAGA12-Luc vector were transfected in U87MG cells. Cells were treated with TGF-β1 in the presence or absence of the inhibitors SIS3 or SB431542 for 24 h. Graphs show fold induction as compared to the untreated pGL3-CAGA12-Luc control. Error bars represent two independent experiments performed in triplicate (upper panel). In parallel, activation of TGF-β signaling was monitored by immunoblotting (lower panel). Dotted line indicates lanes taken from the same gel at the same exposure.
Figure 4
Figure 4. Collagen internalization and expression by glioma cell lines.
(A–B) U87MG and SF188 glioma cells were transfected with control or Endo180 siRNA oligonucleotides for 24 h and then cultured for a further 72 h with or without 5 ng/ml TGF-β1. Cells were then cultured for 2 h at 37°C in the presence of 20 µg/ml OG-collagen as previously described . Cells were trypsin treated to remove cell surface associated collagen and the levels of cell surface Endo180 and internalized collagen were monitored by flow cytometry. (A) Dot plots (isotype matched control labeled cells in the absence of OG-collagen in grey, antibody labeled cells in the presence of OG-collagen in black) show that reduced cell surface expression of Endo180 is matched by reduced collagen uptake. (B) Table showing the mean fluorescence intensities normalized to cells stained with a control isotype matched antibody in the absence of OG-collagen. (C–D) Relative expression of Endo180 (MRC2), COL1A1 and COL1A2 in a panel of 17 glioma cell lines, normal brain and normal human fibroblasts as measured by qPCR. (C) Graph showing relative Endo180 expression related to the highest expresser, KNS42, which was set at 100. All grade IV gliomas (black bars) express higher levels of Endo180 compared to grade III tumors (grey bars). Negligible Endo180 expression was detected in normal brain. (D) Relative expression of the two collagen I genes, COL1A1 (grey bars) and COL1A2 (black bars) related to the highest collagen I expresser, U188MG, which was set at 100.
Figure 5
Figure 5. Fibrillar collagens are abundant in the extracellular matrix of GBMs.
Staining was performed on GBMs for which whole tissue sections were available. Representative images are shown. (A) GBMs stained with Masson's trichrome. Collagen fibers are stained blue/green, nuclei are black and erythrocytes red. Left hand panel shows extensive collagen deposition in the basement membranes associated with the tumor vessels (arrowheads). Right hand panel illustrates collagen fibers within the tumor mass (arrows). Scale bar, 100 µm. (B) Four adjacent FFPE sections of a GBM were stained as follows: Masson's trichrome to visualize fibrillar collagens (upper left panel), immunolabeled with glial fibrillary acidic protein (GFAP; green) and counterstained with DAPI (blue) to visualize tumor cells (lower left panel), immunolabeled with collagen IV or collagen I (white) and Endo180 (red) and counterstained with DAPI (blue) (upper and lower right panels, respectively). Arrowheads indicate large tumor vessels surrounded by a basement membrane containing mainly collagen IV and some collagen I. Arrow indicates an adjacent stromal region containing dense collagen I fibers and smaller tumor vessels. Asterisks indicate GFAP-positive, Endo180-positive regions with extensive collagen I deposition. Scale bar, 150 µm.
Figure 6
Figure 6. Endo180 mediates invasion of glioblastoma cells through a collagen matrix.
(A) SF188 cells were treated with control or Endo180 siRNA oligonucleotides. After 48 h, cells were plated on Transwell inserts coated with collagen I and allowed to migrate towards a high serum concentration for 24 h. Data represents >6 independent experiments. Parallel cultures were subject to immunoblotting to confirm siRNA mediated Endo180 downregulation. (B) Growth of SF188 cells stably infected with control or Endo180 shRNA lentiviruses was monitored over 4 days using Cell Titre-Glo and subject to immunoblotting to confirm shRNA mediated Endo180 downregulation. Error bars represent mean values from two independent experiments each with triplicate samples ±SEM. (C) Control and Endo180 shRNA infected SF188 cells were plated onto a thick collagen I-containing gel and cultured for 11 days. Gels were embedded, sectioned, immunostained with vimentin and an invasion index calculated. Left hand panel shows representative images. Arrows indicate depth of matrix. Right hand panel shows invasion index from 4 independent experiments each with duplicate or triplicate samples. p-values were generated using the student's two-tailed t-test.

Similar articles

Cited by

References

    1. Louis DN, Ohgaki H, Wiestler OD, Cavenee WK, Burger PC, et al. The 2007 WHO classification of tumours of the central nervous system. Acta Neuropathol. 2007;114:97–109. - PMC - PubMed
    1. Nakada M, Nakada S, Demuth T, Tran NL, Hoelzinger DB, et al. Molecular targets of glioma invasion. Cell Mol Life Sci. 2007;64:458–478. - PMC - PubMed
    1. D'Abaco GM, Kaye AH. Integrins: molecular determinants of glioma invasion. J Clin Neurosci. 2007;14:1041–1048. - PubMed
    1. Rao JS. Molecular mechanisms of glioma invasiveness: the role of proteases. Nat Rev Cancer. 2003;3:489–501. - PubMed
    1. Bellail AC, Hunter SB, Brat DJ, Tan C, Van Meir EG. Microregional extracellular matrix heterogeneity in brain modulates glioma cell invasion. Int J Biochem Cell Biol. 2004;36:1046–1069. - PubMed

Publication types