. 2010 Mar 22;188(6):863-76.
doi: 10.1083/jcb.200907135.

The PI3K p110alpha isoform regulates endothelial adherens junctions via Pyk2 and Rac1

Affiliations

The PI3K p110alpha isoform regulates endothelial adherens junctions via Pyk2 and Rac1

Robert J Cain et al. J Cell Biol. .

Abstract

Endothelial cell-cell junctions control efflux of small molecules and leukocyte transendothelial migration (TEM) between blood and tissues. Inhibitors of phosphoinositide 3-kinases (PI3Ks) increase endothelial barrier function, but the roles of different PI3K isoforms have not been addressed. In this study, we determine the contribution of each of the four class I PI3K isoforms (p110alpha, -beta, -gamma, and -delta) to endothelial permeability and leukocyte TEM. We find that depletion of p110alpha but not other p110 isoforms decreases TNF-induced endothelial permeability, Tyr phosphorylation of the adherens junction protein vascular endothelial cadherin (VE-cadherin), and leukocyte TEM. p110alpha selectively mediates activation of the Tyr kinase Pyk2 and GTPase Rac1 to regulate barrier function. Additionally, p110alpha mediates the association of VE-cadherin with Pyk2, the Rac guanine nucleotide exchange factor Tiam-1 and the p85 regulatory subunit of PI3K. We propose that p110alpha regulates endothelial barrier function by inducing the formation of a VE-cadherin-associated protein complex that coordinates changes to adherens junctions with the actin cytoskeleton.


Figures
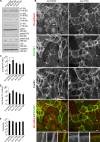
Figure 1.
Figure 1.
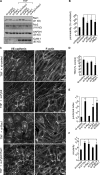
Inhibition of p110α increases junctional overlap in endothelial cells. (A) p110 siRNA–transfected HUVECs were lysed and analyzed by SDS-PAGE and blotting for PI3K subunits and Akt phosphorylation. siRNA oligonucleotides specifically knock down only individual isoforms and do not affect levels of the regulatory p85α subunit. GAPDH was used as a loading control. (B) Immunofluorescence micrographs of HUVECs transfected with p110α or control siRNA. Samples were stained with antibodies to VE-cadherin and PECAM-1 and Alexa Fluor 633–conjugated phalloidin to visualize F-actin. The arrow and arrowheads point to examples of linear and overlapping junctions, respectively. Bottom panels are magnifications of the boxed regions (merged images), showing detail of overlapping junctions. (C–E) Junctional index (junctional area/cell number; C), cell area (D), and cell circularity (E) were determined from immunofluorescence images using ImageJ software. In each case, a minimum of five fields were quantified (∼20 cells per field) per experiment, and data represent the mean and SEM of at least three independent experiments. Statistical significance was assessed by the Mann-Whitney U test; *, P < 0.05. Bars, 20 µm.
Figure 2.
Figure 2.
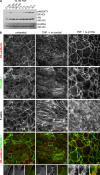
Inhibition of p110α affects cell–cell junctions and cell morphology after TNF-mediated inflammation. (A) HUVECs were either stimulated with TNF (10 min to 18 h) or left unstimulated before lysis, SDS-PAGE, and Western blotting with pAktS473, Akt, and GAPDH antisera. (B) Immunofluorescence micrographs of HUVECs transfected with p110α or control siRNA and either stimulated with TNF (18 h) or left unstimulated before fixation. Samples were stained with antibodies to VE-cadherin and PECAM-1 and Alexa Fluor 633–conjugated phalloidin to visualize F-actin. Bottom panels are magnifications of the boxed regions (merged images), showing detail of a linear junction (untreated), disrupted junctions at the boundary of two elongated cells (TNF + si-control), or overlapping junctions (TNF + si-p110α). The arrowhead shows an example of an overlapping junction. Bars, 20 µm.
Figure 3.
Figure 3.
Inhibition of p110α increases junctional index, cell area, and cell circularity. (A) Immunofluorescence micrographs of HUVECs transfected with p110α or control siRNA and either stimulated with TNF (18 h) or left unstimulated, before fixation. Samples were stained with antibodies to ZO-1 and β-catenin. Right panels are magnifications of the boxed regions (merged images), showing detail of cell–cell junctions. (B–D) Junctional index (junctional area/cell number; B), cell circularity (C), and area (D) were determined from immunofluorescence images using ImageJ software. In each case, a minimum of five fields were quantified (∼20 cells per field) per experiment, and data represent the mean and SEM of at least three independent experiments. Statistical significance was assessed by the Mann-Whitney U test; *, P < 0.05; **, P < 0.02. Bar, 20 µm.
Figure 4.
Figure 4.
Inhibition of p110α increases barrier function in TNF-stimulated endothelial cells. (A) p110 siRNA–transfected HUVECs were either TNF-stimulated (16–18 h; A) or unstimulated before permeability to FITC-dextran was assessed. (B and C) TNF-stimulated (B) and unstimulated (C), p110 siRNA– or VE-cadherin siRNA–transfected HUVECs were seeded at confluence in ECIS electrode chambers, and TER was measured (15 V; 12 h; sampling every 10 min). Data from a stable TER period of 4–6 h were used to calculate mean resistance, and comparisons were made with unstimulated monolayers (assigned as 100%). Mean change in resistance from control is shown. Data represent the mean and SEM of three independent experiments performed in triplicate. Statistical significance was assessed by the Mann-Whitney U test; *, P < 0.05; **, P < 0.02.
Figure 5.
Figure 5.
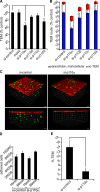
p110α inhibition in endothelial cells reduces leukocyte TEM. (A) THP-1 cells were added to TNF-stimulated, siRNA-transfected HUVECs grown in Transwell chambers, and the resultant TEM efficiency toward MCP-1 was determined after 1 h. (B) T lymphoblasts were added to TNF-stimulated, siRNA-transfected HUVECs and fixed after 15 min. Samples were analyzed by confocal microscopy and scored visually for paracellular and transcellular TEM events (Millán et al., 2006). (C) TNF-stimulated, p110α siRNA– or control siRNA–transfected HUVECs previously labeled with CellTracker orange dye were grown on collagen matrices in Transwell chambers. CellTracker green–labeled THP-1 cells were added to HUVECs, and TEM was allowed to proceed toward an MCP-1 gradient in the lower chamber for either 10 or 60 min before fixation; confocal z stacks were then collected. 3D reconstructions were produced using Volocity software. A small gamma correction was applied to the red channel to visualize weak cell tracker staining at the edges of cell, which are difficult to distinguish upon 3D rendering. (D and E) Quantification of adhesion to endothelial cells (D) or TEM (THP-1 cells within the collagen matrix; E). Results represent the mean and SEM of at least three independent experiments. Statistical significance was assessed by the Mann-Whitney U test; *, P < 0.05; **, P < 0.02. Bars, 40 µm.
Figure 6.
Figure 6.
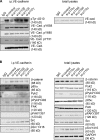
Inhibition of p110α reduces VE-cadherin Tyr phosphorylation and Pyk2 activity. (A and B) TNF-stimulated, siRNA-transfected HUVECs were lysed, and VE-cadherin was immunoprecipitated (i.p.). Samples were separated by SDS-PAGE and analyzed by Western blotting with antibodies to total phospho-Tyr and for VE-cadherin phosphorylated at Y658, Y685, and Y731 (A) and other proteins as indicated (B). Total lysates were probed in parallel (blots on right) to control for variations in protein level.
Figure 7.
Figure 7.
Pyk2 activity is increased by TNF stimulation. Endothelial cells were either stimulated with TNF (10 min to 18 h) or left unstimulated before lysis, SDS-PAGE, and immunoblotting with pY402-Pyk2, Pyk2, and GAPDH antisera.
Figure 8.
Figure 8.
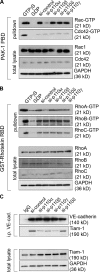
p110α depletion decreases RhoA and Rac but not Cdc42 activity. (A and B) TNF-stimulated, p110 siRNA–transfected HUVECs were lysed, and Rho GTPase activity was determined by affinity for GST-Rhotekin-RBD– or GST-PAK1-PBD–conjugated beads for RhoA/B/C and Rac/Cdc42, respectively. After washing, samples were separated by SDS-PAGE and analyzed by Western blotting with antibodies to Rac1 or Cdc42 (A) or RhoA, -B, or -C (B). Total lysates (bottom) of each sample were Western blotted in parallel to control for total amounts of GTPase. GAPDH was used as a loading control. (C) PI3K inhibition reduces Tiam-1 association with VE-cadherin. TNF-stimulated, siRNA-transfected HUVECs were lysed, and VE-cadherin was immunoprecipitated (i.p.). Samples were separated by SDS-PAGE and analyzed by Western blotting with antibodies to Tiam-1. Total lysates (bottom) were probed in parallel to control for variations in protein level. GAPDH was used as a loading control.
Figure 9.
Figure 9.
Pyk2 and Rac1 depletion alter endothelial junctions and leukocyte TEM. HUVECs were transfected with either control siRNA or siRNA to Pyk2 and/or Rac1 and then stimulated with TNF (18 h) or left unstimulated. (A) HUVECs were lysed and analyzed by SDS-PAGE and Western blotting with Pyk2, Rac1, and GAPDH antibodies to assess siRNA knockdown efficiency and ICAM-1 to assess TNF stimulation. The asterisk indicates a nonspecific band; Rac1 is the top band. (B) Barrier function of siRNA-treated HUVECs either stimulated with TNF (16–18 h) or left unstimulated was assessed by permeability to FITC-dextran. Unstimulated monolayers were assigned as 100%. (C) Immunofluorescence micrographs of siRNA-transfected HUVECs. Samples were stained with antibodies to VE-cadherin and Alexa Fluor 633–conjugated phalloidin to visualize F-actin. Arrowheads indicate examples of overlapping junctions. (D) THP-1 cells were added to siRNA-treated, TNF-stimulated HUVECs in Transwell chambers, and the resultant TEM efficiency toward MCP-1 was determined after 1 h. (E and F) Junctional index (junctional area/cell number; E) and cell circularity (F) were determined from immunofluorescence images. Data represent the mean and SEM of at least four independent experiments, each performed in triplicate. Statistical significance was assessed by the Mann-Whitney U test; *, P < 0.05; **, P < 0.02. Bars, 20 µm.

Similar articles

Cited by

References

    1. Aghajanian A., Wittchen E.S., Allingham M.J., Garrett T.A., Burridge K. 2008. Endothelial cell junctions and the regulation of vascular permeability and leukocyte transmigration. J. Thromb. Haemost. 6:1453–1460 10.1111/j.1538-7836.2008.03087.x - DOI - PMC - PubMed
    1. Allingham M.J., van Buul J.D., Burridge K. 2007. ICAM-1-mediated, Src- and Pyk2-dependent vascular endothelial cadherin tyrosine phosphorylation is required for leukocyte transendothelial migration. J. Immunol. 179:4053–4064 - PubMed
    1. Angelini D.J., Hyun S.W., Grigoryev D.N., Garg P., Gong P., Singh I.S., Passaniti A., Hasday J.D., Goldblum S.E. 2006. TNF-α increases tyrosine phosphorylation of vascular endothelial cadherin and opens the paracellular pathway through fyn activation in human lung endothelia. Am. J. Physiol. Lung Cell. Mol. Physiol. 291:L1232–L1245 10.1152/ajplung.00109.2006 - DOI - PubMed
    1. Barreiro O., Yanez-Mo M., Serrador J.M., Montoya M.C., Vicente-Manzanares M., Tejedor R., Furthmayr H., Sanchez-Madrid F. 2002. Dynamic interaction of VCAM-1 and ICAM-1 with moesin and ezrin in a novel endothelial docking structure for adherent leukocytes. J. Cell Biol. 157:1233–1245 10.1083/jcb.200112126 - DOI - PMC - PubMed
    1. Basile J.R., Gavard J., Gutkind J.S. 2007. Plexin-B1 utilizes RhoA and Rho kinase to promote the integrin-dependent activation of Akt and ERK and endothelial cell motility. J. Biol. Chem. 282:34888–34895 10.1074/jbc.M705467200 - DOI - PubMed

Publication types

MeSH terms