. 2010 Mar 26;32(3):414-25.
doi: 10.1016/j.immuni.2010.03.004. Epub 2010 Mar 18.

Astrocyte-restricted ablation of interleukin-17-induced Act1-mediated signaling ameliorates autoimmune encephalomyelitis

Affiliations

Astrocyte-restricted ablation of interleukin-17-induced Act1-mediated signaling ameliorates autoimmune encephalomyelitis

Zizhen Kang et al. Immunity. .

Abstract

Interleukin-17 (IL-17) secreted by T helper 17 (Th17) cells is essential in the development of experimental autoimmune encephalomyelitis (EAE). However, it remains unclear how IL-17-mediated signaling in different cellular compartments participates in the central nervous system (CNS) inflammatory process. We examined CNS inflammation in mice with specific deletion of Act1, a critical component required for IL-17 signaling, in endothelial cells, macrophages and microglia, and neuroectoderm (neurons, astrocytes, and oligodendrocytes). In Act1-deficient mice, Th17 cells showed normal infiltration into the CNS but failed to recruit lymphocytes, neutrophils, and macrophages. Act1 deficiency in endothelial cells or in macrophages and microglia did not substantially impact the development of EAE. However, targeted Act1 deficiency in neuroectoderm-derived CNS-resident cells resulted in markedly reduced severity in EAE. Specifically, Act1-deficient astrocytes showed impaired IL-17-mediated inflammatory gene induction. Thus, astroctyes are critical in IL-17-Act1-mediated leukocyte recruitment during autoimmune-induced inflammation of the CNS.


Figures
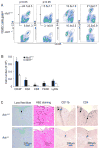
Figure 1
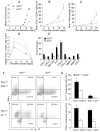
Figure 1. Act1 deficiency impairs inflammatory cell infiltration in the CNS
(A–B) Immune cell infiltration in the brains of MOG35-55 immunized wild-type and Act1−/− mice (n=7, 7 days after disease onset) was analyzed by flow cytometry. Error bars, SEM *, p<0.05. (C) Luxol fast blue, hematoxylin and eosin, and anti-CD11b and CD4 staining of spinal cores of wild-type and Act1-deficient mice at peak of disease. Data are representative of three independent experiments. See also Figure S1.
Figure 2
Figure 2. Act1 is required for the effector stage of Th17-, but not Th1-induced EAE
(A) Draining lymph node cells from wild-type mice and Act1−/− mice 10 days after immunization with MOG35-55 were re-stimulated with MOG35-55 in vitro for 4 days, followed by ELISA of IL-17, IFN-γ. Error bars, SEM; n = 5 mice per group. *, p<0.05. (B–D) Primed MOG35-55 specific T cells (10 days) from (B) wild-type or (C) Act1−/− mice were re-stimulated with MOG35-55 in vitro in the presence of recombinant IL-23 for 5 days, and then transferred to naïve wild-type or Act1−/− mice. Graph represents the average clinical score after T-cell transfer. (D) Primed MOG35-55 specific wild-type T cells (10 days) were re-stimulated with MOG35-55 in vitro in the presence of recombinant IL-12 and anti-IL-23p19 for 5 days, and then transferred to naïve wild-type and Act1−/− mice. Graph represents the average clinical score after T-cell transfer. (E) H&E staining of the spinal cords of wild-type and Act1−/− mice transferred with Th1 and Th17 cells and sacrificed 7 days after the onset of disease. (F) Immune cell infiltration in the brains of wild-type and Act1−/− mice transferred with wild-type Th1 cells (n=5, 7 days after disease onset) was analyzed by flow cytometry. Error bars, SEM. Data are representative of three independent experiments. See also Figure S2.
Figure 3
Figure 3. Th17 cells can infiltrate CNS but fail to initiate effective inflammatory cascade in Act1−/− mice
(A) Mean clinical score of wild-type and Act1−/− mice adoptively transferred with MOG-specific Thy1.1+ Th17 cells (n=4/group). Lymph node cells harvested from Thy1.1 C57BL/6 mice 10 days after immunization with MOG35-55 were polarized to Th17 cells as described in Figure 2, and transferred to wild-type and Act1−/− mice. Graph represents the average clinical score after T-cell transfer. (B–D) Immune cell infiltration in the (B,C) brain and(D) spleen of wild-type and Act1−/− mice transferred with MOG-specific Thy1.1+ Th17 cells (n=5/group, 3, 5, 12, and 15 days after T cell transfer) was analyzed by flow cytometry. Error bars, SEM; *, p<0.05. (E) Real-time PCR analysis of relative expression of inflammatory genes as indicated in spinal cords of wild-type and Act1−/− mice transferred with MOG-specific Thy1.1+ Th17 cells (n=3, 15 days after T cell transfer) compared to the control samples from naïve mice. (FG) Intracellular staining for the infiltrated IL-17-secreting or IFN-γ-secreting Thy1.1+CD4+T cells and Thy1.1+γδT cells in the brain of wild-type and Act1−/− mice transferred with MOG-specific Thy1.1+ Th17 cells (n=10/group, 15 days after T cell transfer). The frequency of IL-17+ or IFN-γ+ cells in Thy1.1+CD4+ cell population (upper panel) and Thy1.1+ γδT cells (lower panel) were shown in (F) and the corresponding absolute cell numbers were shown in G. See also Figure S2.
Figure 4
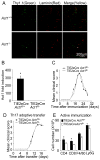
Figure 4. Act1 deficiency in the recipient mice does not impact on the proliferation and survival of the infiltrated Th17 cells
(A) Immunofluorescent staining for Ki67-positive Thy1.1 cells in the spinal cords of wild-type and Act1-deficient mice transferred with MOG-specific Thy1.1+ Th17 cells (n=4), 12 days after T cell transfer). Frozen sections of spinal cords collected from the recipient mice were stained with Thy1.1 (red) and Ki67 (green) antibodies. The presented frequency of Ki67+ cells in total Thy1.1+ cells in the spinal cord was an average of four spinal cord regions each group. Error bars, SEM. (B) Brdu incorporation of infiltrated T cells in the spinal cords of wild-type and Act1−/− mice transferred with MOG-specific Thy1.1+ Th17 cells (n=4), 12 days after T cell transfer). On day 12 after adoptive transfer of MOG-specific Thy1.1+ Th17 cells, wild-type and Act1−/− recipient were administrated with Brdu (i.p., 1mg/mouse). Spinal cords were collected from the recipient mice 12 h after Brdu administration and stained with Brdu antibody (red) and CD4 antibody (green). The presented percentage of Brdu-positive cells in total CD4+ cells was an average of four spinal cord regions each group. Error bars, SEM.
Figure 5
Figure 5. Endothelial-derived Act1 is dispensable for EAE development
(A) Immunofluorescent staining of CD4+ T cells relative to the vasculature in the spinal cord. Spinal cords of wild-type and Act1−/− mice transferred with MOG-specific Thy1.1+ Th17 cells (n=3, 12 days after T cell transfer) were stained with CD4 (green) and pan-laminin (red) antibodies. The presented data is a representative of three independent experiments. (B) Real-time PCR for the Act1 expression in PECAM-1+ heart endothelial cells from endothelial-specific Act1-deficient (TIE2eCreAct1fl/−) and control mice (TIE2eCreAct1fl/+). (C) Mean clinical score of EAE in TIE2eCreAct1fl/− and TIE2eCreAct1fl/+ induced by active immunization with MOG35-55 (n=5/group). (D) Mean clinical score of EAE in TIE2eCreAct1fl/− and TIE2eCreAct1fl/+ mice induced by MOG-specific wild-type Th17 cells. (E) Flow cytometry analysis of immune cell infiltration in the brains of MOG35-55 immunized TIE2eCreAct1fl/− and TIE2eCreAct1fl/+ mice (n=5, 14 days after disease onset). Error bars, SEM; *, p<0.05.
Figure 6
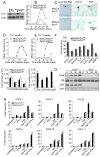
Figure 6. Macrophage- and Microglial-derived Act1 are dispensable for EAE development
(A) Real-time PCR for the Act1expression in bone marrow-derived macrophages and microglia from the macrophage/microglia-specific Act1-deficient (CD11bCreAct1fl/−) and control mice (CD11bCreAct1fl/+). (B) Immunoblot analysis for the Act1 expression in bone marrow-derived macrophages from the macrophage and microglia-specific Act1-deficient (CD11bCreAct1fl/−) and control mice (CD11bCreAct1fl/+). (C) Mean clinical score of EAE in CD11bCre Act1fl/− and CD11bCre Act1fl/+ mice induced by active immunization with MOG35-55 (n=5/group). (D) Mean clinical score of EAE in the CD11bCreAct1fl/− and CD11bCreAct1fl/+ mice induced by MOG-specific Th17 cells. (E) Flow cytometry analysis of immune cell infiltration in the brains of MOG35-55 immunized CD11bCreAct1fl/− and CD11bCreAct1fl/+ mice (n=5, 7 days after disease onset). Error bars, SEM; *, p<0.05.
Figure 7
Figure 7. Amelioration of EAE by targeting Act1 in CNS resident cells derived from neuroectodermal cells
(A) Immunoblot analysis for the Act1 expression in the brains and astrocytes from CNS-restricted Act1-deficient (NesCreAct1fl/−) and control mice (NesCreAct1fl/+). (B) Mean clinical score of EAE in NesCreAct1fl/− and NesCreAct1fl/+ mice induced by active immunization with MOG35-55. (C) Luxol fast blue, anti-CD11b and anti-CD4 staining of spinal cores of NesCreAct1fl/− and NesCreAct1fl/+ mice after immunization with MOG35-55 (n=5, 7 days after disease onset). Data are representative of three independent experiments. (D) Mean clinical score of Th1-induced EAE (upper panel) and flow cytometry analysis of immune cell infiltration in the brains (lower panel) of NesCreAct1fl/− and NesCreAct1fl/+ mice (n=5, 15 days after T cell transfer). (E) Mean clinical score of Th17-induced EAE (upper panel) and flow cytometry analysis of immune cell infiltration in the brains (lower panel) of NesCreAct1fl/− and NesCreAct1fl/+ mice (n=5, 15 days after T cell transfer). (F) Real-time PCR analysis of relative expression of inflammatory genes as indicated in spinal cords of NesCreAct1fl/− and NesCreAct1fl/+ mice transferred with MOG-specific Th17 cells (n=3, 15 days after T cell transfer) compared to the control samples from naïve mice. (G) Primary astrocytes from NesCreAct1fl/− and NesCreAct1fl/+ mice were treated with 50 ng/ml IL-17 for the indicated times and analyzed by immunoblot with indicated antibodies. (H) Differential regulation of chemokines by IL-17 and IFN-γ in astrocytes Astrocytes from NesCreAct1fl/− and NesCreAct1fl/+ mice were treated with 50ng/ml IL-17, 10ng/ml TNF-α, 10ng/ml IFN-γ, medium alone, IL-17+ TNF-α and TNF-α+IFN-γ for 16hr, followed by real-time PCR for the expression of inflammatory genes as indicated. The data are presented as mean±SEM from three independent experiments (*p<0.05). See also Figure S3–S4.

Comment in

Similar articles

Cited by

References

    1. Agrawal A, Dillon S, Denning TL, Pulendran B. ERK1−/− mice exhibit Th1 cell polarization and increased susceptibility to experimental autoimmune encephalomyelitis. J Immunol. 2006;176:5788–5796. - PubMed
    1. Aloisi F. Immune function of microglia. Glia. 2001;36:165–179. - PubMed
    1. Awane M, Andres PG, Li DJ, Reinecker HC. NF-kappa B-inducing kinase is a common mediator of IL-17-, TNF-alpha-, and IL-1 beta-induced chemokine promoter activation in intestinal epithelial cells. J Immunol. 1999;162:5337–5344. - PubMed
    1. Bauer M, Brakebusch C, Coisne C, Sixt M, Wekerle H, Engelhardt B, Fassler R. Beta1 integrins differentially control extravasation of inflammatory cell subsets into the CNS during autoimmunity. Proc Natl Acad Sci U S A. 2009;106:1920–1925. - PMC - PubMed
    1. Becher B, Bechmann I, Greter M. Antigen presentation in autoimmunity and CNS inflammation: how T lymphocytes recognize the brain. J Mol Med. 2006;84:532–543. - PubMed

Publication types

MeSH terms

Substances