. 2010 Mar 19:4:29.
doi: 10.1186/1752-0509-4-29.

A novel approach to investigate tissue-specific trinucleotide repeat instability

Affiliations

A novel approach to investigate tissue-specific trinucleotide repeat instability

Jong-Min Lee et al. BMC Syst Biol. .

Abstract

Background: In Huntington's disease (HD), an expanded CAG repeat produces characteristic striatal neurodegeneration. Interestingly, the HD CAG repeat, whose length determines age at onset, undergoes tissue-specific somatic instability, predominant in the striatum, suggesting that tissue-specific CAG length changes could modify the disease process. Therefore, understanding the mechanisms underlying the tissue specificity of somatic instability may provide novel routes to therapies. However progress in this area has been hampered by the lack of sensitive high-throughput instability quantification methods and global approaches to identify the underlying factors.

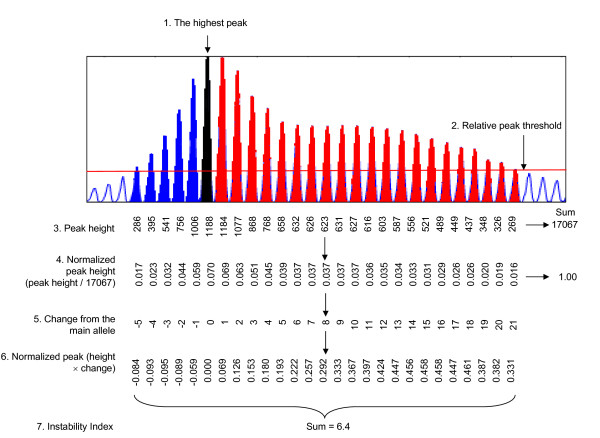
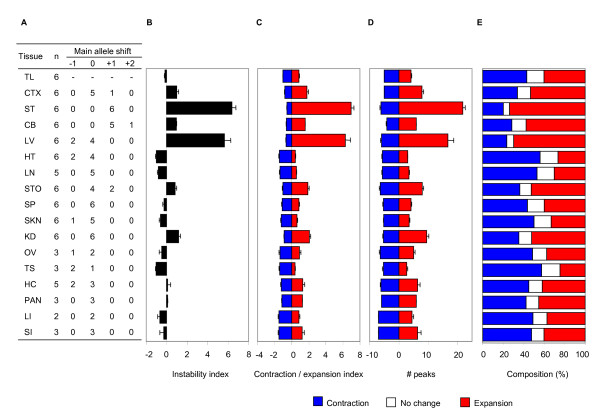
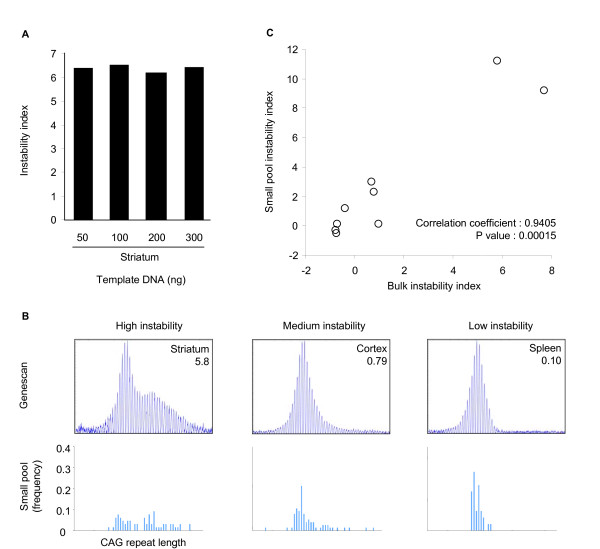
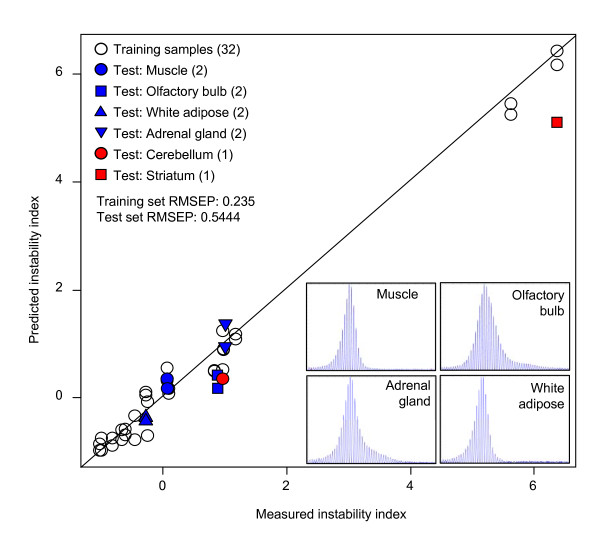
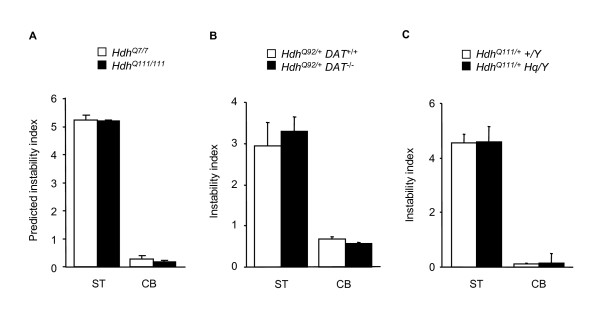
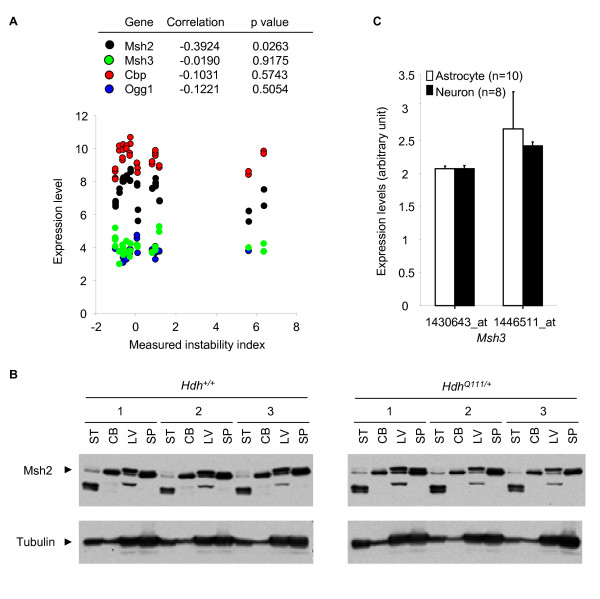
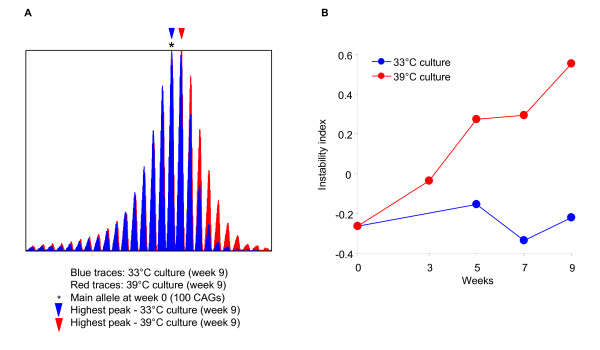
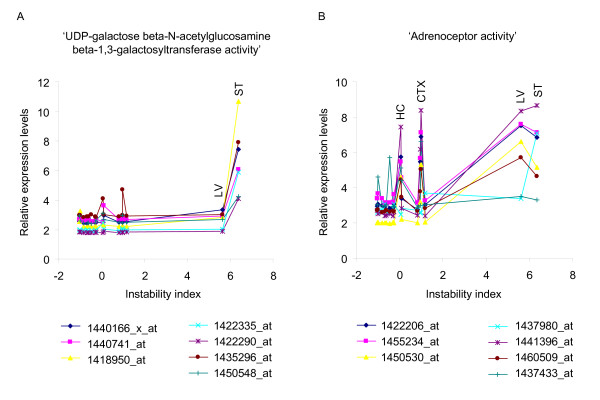
Results: Here we describe a novel approach to gain insight into the factors responsible for the tissue specificity of somatic instability. Using accurate genetic knock-in mouse models of HD, we developed a reliable, high-throughput method to quantify tissue HD CAG repeat instability and integrated this with genome-wide bioinformatic approaches. Using tissue instability quantified in 16 tissues as a phenotype and tissue microarray gene expression as a predictor, we built a mathematical model and identified a gene expression signature that accurately predicted tissue instability. Using the predictive ability of this signature we found that somatic instability was not a consequence of pathogenesis. In support of this, genetic crosses with models of accelerated neuropathology failed to induce somatic instability. In addition, we searched for genes and pathways that correlated with tissue instability. We found that expression levels of DNA repair genes did not explain the tissue specificity of somatic instability. Instead, our data implicate other pathways, particularly cell cycle, metabolism and neurotransmitter pathways, acting in combination to generate tissue-specific patterns of instability.

Conclusion: Our study clearly demonstrates that multiple tissue factors reflect the level of somatic instability in different tissues. In addition, our quantitative, genome-wide approach is readily applicable to high-throughput assays and opens the door to widespread applications with the potential to accelerate the discovery of drugs that alter tissue instability.


Figures

Figure 1
Figure 1
Instability index determination using a relative peak height threshold. To quantify the levels of instability from GeneMapper traces peak height was used to determine a relative threshold of 20%. Peaks falling below his threshold were excluded from analysis. Peak heights normalized to the total of all peak heights were multiplied by the change in CAG length of each peak relative to the highest peak in tail (main allele). These values were summed to generate an instability index. Striatum analysis is shown as an example (HdhQ111/+, 5 months, 100 ng genomic DNA). Open, blue, black, and red peaks represent background, contracted alleles, main allele from tail analysis of same mouse, and expanded alleles, respectively.
Figure 2
Figure 2
Reproducibility of instability quantification methods. Instability indices were determined from 100 ng genomic DNA isolated from 17 tissues of 2-6 HdhQ111/+ mice at 5 months of age. (A) The table shows replicate number of mice for each tissue (n) and numbers of samples where the highest peak was shifted from the main allele (tail's highest peak). Zero indicates no major allele shift and +1 indicates one CAG unit increase. B. Instability index. (C, D, E) The relative peak height correction method was applied to different methods of quantification such as: a contraction and expansion index (C), the number of contracted/expanded peaks (D) and the relative composition of contracted/unchanged/expanded peaks (E). Data bars represent mean ± SE. TL, tail; CTX, cortex; ST, striatum; CB, cerebellum; LV, liver; HT, heart; LN, lung; STO, stomach; SP, spleen, SKN, skin; KD, kidney; OV, ovary; TS, testis; HC, hippocampus; PAN, pancreas; LI, large intestine; and SI, small intestine.
Figure 3
Figure 3
Evaluation of instability index. (A) To assess the sensitivity of the instability index to the amount of input DNA we calculated instability indices using varying amounts of template DNA (HdhQ111/, 5 months, striatum). The coefficient of variation (CV) of the striatal instability index was 2.2%, calculated by dividing the standard deviation of 4 instability index measurements (50, 100, 200, and 300 ng DNA) by the mean instability indices of same 4 measurements. (B) GeneMapper traces and instability indices from bulk DNA (100 ng) and frequency distributions of CAG repeat length obtained using small pool-PCR from striatum, cortex and spleen from an HdhQ111/+ mouse at 5 months of age. (C) Instability indices from bulk DNA (100 ng) GeneMapper traces were plotted against small pool instability indices (see Methods section) obtained from 9 tissues (striatum, cortex, cerebellum, liver, lung, stomach, skin, heart, ovary) of an HdhQ111/+ mouse at 5 months of age. The two values were highly correlated.
Figure 4
Figure 4
Instability-correlated gene expression signature and regression modeling. To identify an instability-correlated gene expression signature, instability index was modeled as a function of gene expression using the mouse Gene Expression Atlas. We calculated the correlation between instability index and expression level, and built regression models by sequentially introducing top n number of the most highly correlated probes with instability index (16 training tissues, 2 gene expression replicates) using partial least square regression (PLSR). The lowest error rate (root mean squared error of prediction, RMSEP) in leave one out cross validation (0.235) was obtained by modeling of the 150 most correlated probes. The predictive power of the model was verified by two independent test sets. Firstly, we determined instability indices of 4 additional tissues, muscle, olfactory bulb, white adipose tissue and adrenal gland (HdhQ111/+, 5 months, n = 4-6 mice), and compared them with instability indices predicted by the regression model (blue, 2 gene expression replicates). Secondly, we predicted instability indices using independent striatum and cerebellum microarray data (GSE9025, HdhQ111/+, 5 months, n = 1), and compared them to measured instability indices (red). RMSEP, root mean squared error of prediction.
Figure 5
Figure 5
HD pathogenesis and somatic instability. (A) We profiled gene expression in striatum and cerebellum in HdhQ111/111 and control (Hdh+/+) mice at 10 weeks of age (GSE19780). Expression values of the 150 instability-correlated probes were used to predict instability indices based on our regression model. Data bars represent mean ± SD (n = 3-5 mice per genotype). (B) Dopamine transporter (DAT) knockout mice were crossed with HdhQ92 mice to test if accelerated HD pathogenesis increases instability (8-10 months, n = 3-4 mice per genotype). Instability indices were measured in striatum and cerebellum. Cerebellum was included as a control tissue that does not show accelerated HD pathology. (C) Hq/+ mice were crossed with HdhQ111 mice to test if pathology in cerebellar granule cells can induce somatic instability (4 months, n = 3 mice per genotype). Instability indices were measured in striatum and cerebellum. Striatum was included as a control tissue that does not show Hq-mediated neurodegeneration. In addition, the Hq mutation did not increase HD CAG instability in cerebellum at either 5 weeks (n = 3-4 per mice genotype) proceeding overt neurodegeneration, or at 7 months (n = 3-4 mice per genotype) when the mice exhibit significant neurodegeneration (data not shown).
Figure 6
Figure 6
Candidate DNA repair genes and somatic instability. (A) Gene expression levels (Msh2, Msh3, Cbp, Ogg1) and measured instability indices of 16 training tissues were plotted. Among multiple probes representing the same gene, the probe with the highest expression level in striatum was selected. Expression levels showed insignificant correlations for Msh3, Cbp and Ogg1 and a negative correlation for Msh2 with measured instability indices. (B) Protein levels of Msh2 were measured in 2 unstable (striatum and liver) and 2 stable tissues (cerebellum and spleen) from HdhQ111/+ and corresponding control mice (n = 3 mice per genotype, 2 months). Whole cell protein extracts (70 μg) were resolved by SDS-PAGE (6%) and western blots were performed for Msh2 (Santa Cruz Biotechnology) and Tubulin (Cell Signaling). ST, striatum; CB, cerebellum; LV, liver; SP, spleen. (C) Microarray expression levels of Msh3 (Affymetrix probe ID, 1430643_at and 1446511_at) in FACS-purified astrocytes and neurons were obtained from the GSE9566 data set. Msh3 expression level in astrocytes was not significantly different from that in neurons. Data bar represents mean of log2 expression levels ± SD (n = 8-10).
Figure 7
Figure 7
The effect of cell proliferation on instability index. (A) STHdhQ111/+ cells were maintained at the restrictive temperature (39°C) (no cell division) for 9 weeks without subculture (red), and control cultures at the permissive temperature (33°C) (actively dividing) were subcultured every week (blue). GeneMapper traces of genomic DNA isolated at 9 weeks are shown. (B) For the time-course study, cultures grown at 39°C and at 33°C were harvested at 0, 3, 5, 7 and 9 weeks, and genomic DNA was analyzed to calculate the instability index. Representative GeneMapper traces and instability indices are shown from three independent experiments.
Figure 8
Figure 8
Different combinations of many processes may be responsible for the different levels of somatic instability. To investigate the levels of contributions from significant pathways in each tissue, we identified highly correlative probes (absolute Pearson coefficients > 0.6) in the two most significantly positively correlated gene sets, and plotted relative expression levels against measured instability indices in the 16 training set tissues. (A) 'UDP-galactose beta-N-acetylglucosamine beta-1,3-galactosyltransferase activity' gene set was the most significant pathway in the gene set analysis (positive correlation). This gene set is composed of 21 probes, and 7 probes were highly correlative (correlation coefficient > 0.6). The expression levels of these 7 probes in liver were low compared to those in striatum although instability indices are similar in these tissues. (B) 'Adrenoceptor activity' gene set was the second most significant pathway (positive correlation), and has 25 probes as members, of which 7 were highly correlative (correlation coefficient > 0.6). Interestingly, cortex or hippocampus showed similar expression levels of the highly correlative probes in this gene set to those in striatum, although instability indices in cortex or hippocampus were significantly lower than that of striatum. Graphs show 7 highly correlated probes for each gene set, and IDs are Affymetrix MG430 2.0 probe set IDs.

Similar articles

Cited by

References

    1. Ashizawa T, Dubel JR, Harati Y. Somatic instability of CTG repeat in myotonic dystrophy. Neurology. 1993;43:2674–2678. - PubMed
    1. Fortune MT, Vassilopoulos C, Coolbaugh MI, Siciliano MJ, Monckton DG. Dramatic, expansion-biased, age-dependent, tissue-specific somatic mosaicism in a transgenic mouse model of triplet repeat instability. Hum Mol Genet. 2000;9:439–445. doi: 10.1093/hmg/9.3.439. - DOI - PubMed
    1. Kennedy L, Evans E, Chen CM, Craven L, Detloff PJ, Ennis M, Shelbourne PF. Dramatic tissue-specific mutation length increases are an early molecular event in Huntington disease pathogenesis. Hum Mol Genet. 2003;12:3359–3367. doi: 10.1093/hmg/ddg352. - DOI - PubMed
    1. Kennedy L, Shelbourne PF. Dramatic mutation instability in HD mouse striatum: does polyglutamine load contribute to cell-specific vulnerability in Huntington's disease? Hum Mol Genet. 2000;9:2539–2544. doi: 10.1093/hmg/9.17.2539. - DOI - PubMed
    1. Watase K, Venken KJ, Sun Y, Orr HT, Zoghbi HY. Regional differences of somatic CAG repeat instability do not account for selective neuronal vulnerability in a knock-in mouse model of SCA1. Hum Mol Genet. 2003;12:2789–2795. doi: 10.1093/hmg/ddg300. - DOI - PubMed

Publication types