

Polymerization and matrix physical properties as important design considerations for soluble collagen formulations
- PMID: 20235198
- PMCID: PMC2880202
- DOI: 10.1002/bip.21431
Polymerization and matrix physical properties as important design considerations for soluble collagen formulations
Abstract
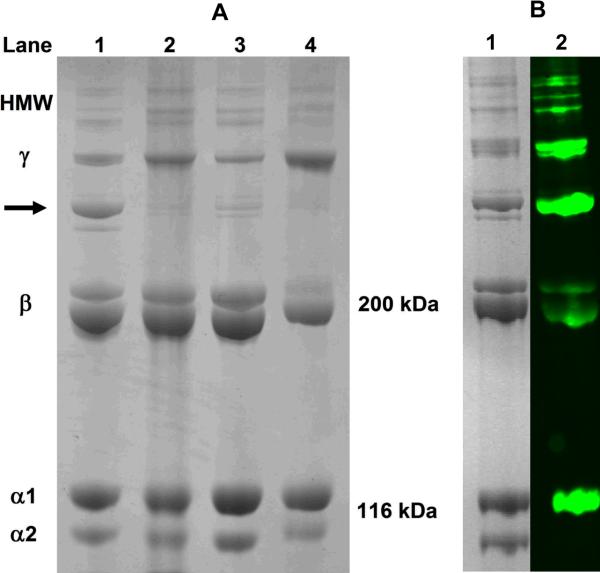
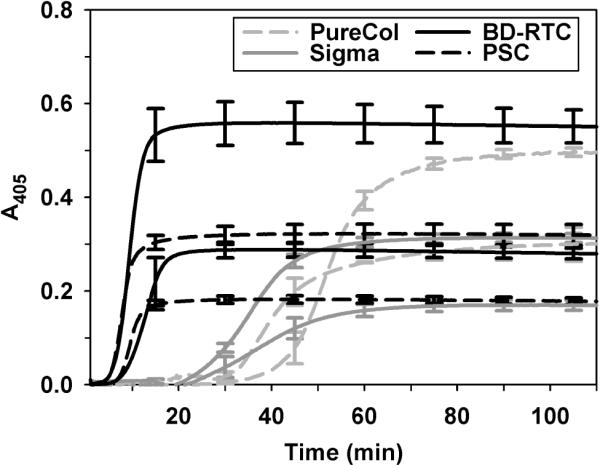
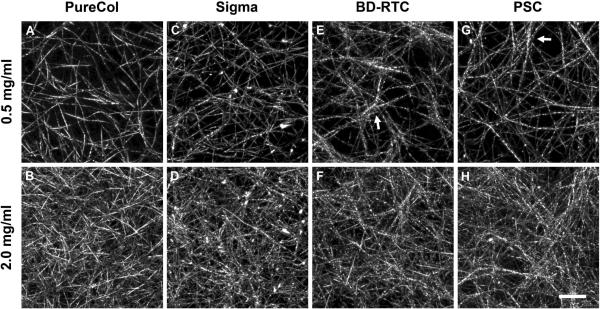
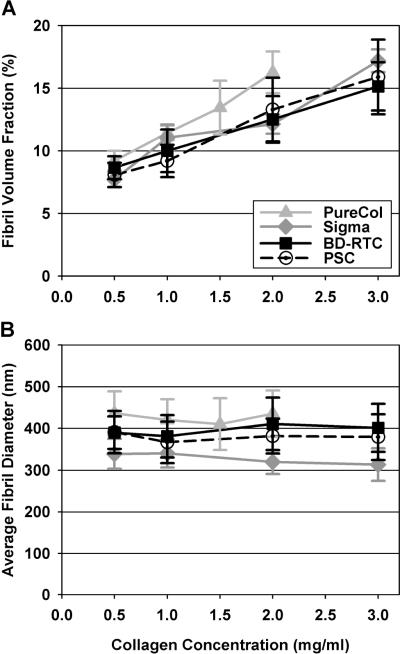
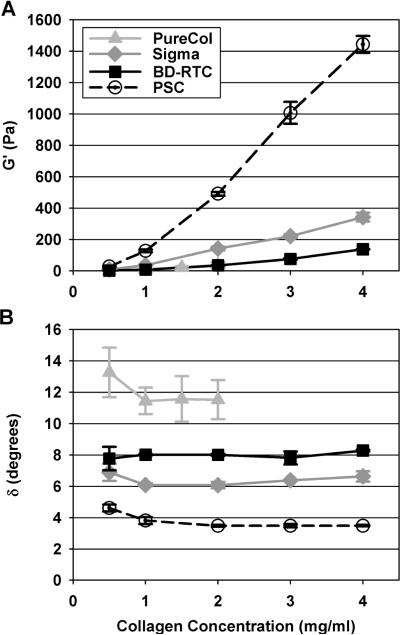
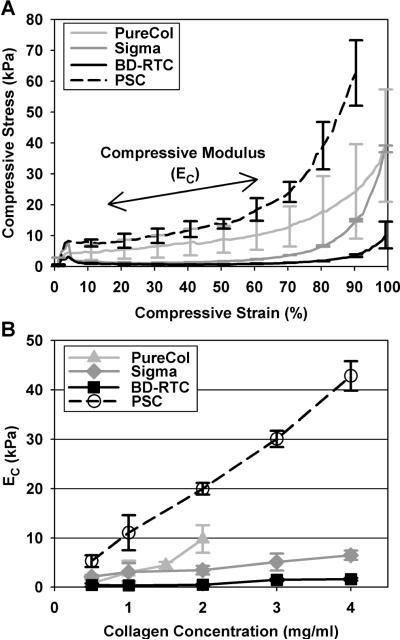
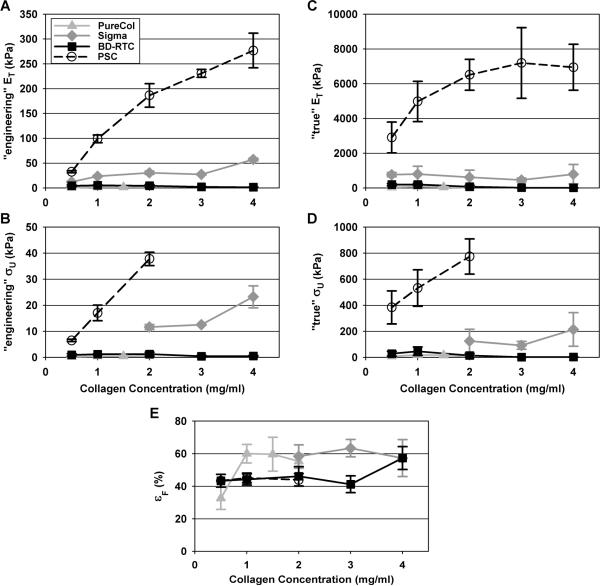
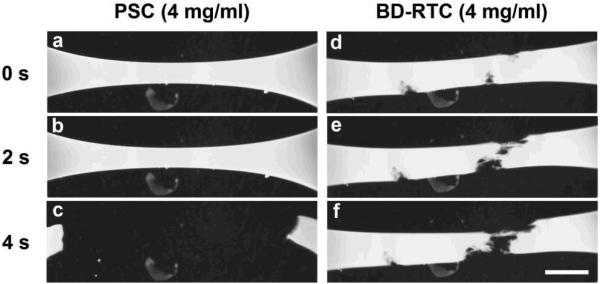
Despite extensive use of type I collagen for research and medical applications, its fibril-forming or polymerization potential has yet to be fully defined and exploited. Here, we describe a type I collagen formulation that is acid solubilized from porcine skin collagen (PSC), quality controlled based upon polymerization potential, and well suited as a platform polymer for preparing three-dimensional (3D) culture systems and injectable/implantable in vivo cellular microenvironments in which both relevant biochemical and biophysical parameters can be precision-controlled. PSC is compared with three commercial collagens in terms of composition and purity as well as polymerization potential, which is described by kinetic parameters and fibril microstructure and mechanical properties of formed matrices. When subjected to identical polymerization conditions, PSC showed significantly decreased polymerization times compared to the other collagens and yielded matrices with the greatest mechanical integrity and broadest range of mechanical properties as characterized in oscillatory shear, uniaxial extension, and unconfined compression. Compositional and intrinsic viscosity analyses suggest that the enhanced polymerization potential of PSC may be attributed to its unique oligomer composition. Collectively, this work demonstrates the importance of standardizing next generation collagen formulations based upon polymerization potential and provides preliminary insight into the contribution of oligomers to collagen polymerization properties.
Figures
Similar articles
-
Collagen oligomers modulate physical and biological properties of three-dimensional self-assembled matrices.Biopolymers. 2011 Feb;95(2):77-93. doi: 10.1002/bip.21537. Epub 2010 Aug 24. Biopolymers. 2011. PMID: 20740490 Free PMC article.
-
Fibril microstructure affects strain transmission within collagen extracellular matrices.J Biomech Eng. 2009 Mar;131(3):031004. doi: 10.1115/1.3005331. J Biomech Eng. 2009. PMID: 19154063
-
Time-lapse confocal reflection microscopy of collagen fibrillogenesis and extracellular matrix assembly in vitro.Biopolymers. 2000 Sep;54(3):222-34. doi: 10.1002/1097-0282(200009)54:3<222::AID-BIP80>3.0.CO;2-K. Biopolymers. 2000. PMID: 10861383
-
Tensile mechanical properties of three-dimensional type I collagen extracellular matrices with varied microstructure.J Biomech Eng. 2002 Apr;124(2):214-22. doi: 10.1115/1.1449904. J Biomech Eng. 2002. PMID: 12002131
-
Oligomers modulate interfibril branching and mass transport properties of collagen matrices.Microsc Microanal. 2013 Oct;19(5):1323-33. doi: 10.1017/S1431927613001931. Epub 2013 Jul 10. Microsc Microanal. 2013. PMID: 23842082 Free PMC article.
Cited by
-
Effect of Nuclear Stiffness on Cell Mechanics and Migration of Human Breast Cancer Cells.Front Cell Dev Biol. 2020 May 29;8:393. doi: 10.3389/fcell.2020.00393. eCollection 2020. Front Cell Dev Biol. 2020. PMID: 32548118 Free PMC article.
-
Establishing epithelial glandular polarity: interlinked roles for ARF6, Rac1, and the matrix microenvironment.Mol Biol Cell. 2012 Dec;23(23):4495-505. doi: 10.1091/mbc.E12-03-0246. Epub 2012 Oct 10. Mol Biol Cell. 2012. PMID: 23051733 Free PMC article.
-
Assessment of the Influence of Acetic Acid Residue on Type I Collagen during Isolation and Characterization.Materials (Basel). 2018 Dec 11;11(12):2518. doi: 10.3390/ma11122518. Materials (Basel). 2018. PMID: 30545004 Free PMC article.
-
Native human collagen type I provides a viable physiologically relevant alternative to xenogeneic sources for tissue engineering applications: A comparative in vitro and in vivo study.J Biomed Mater Res B Appl Biomater. 2022 Oct;110(10):2323-2337. doi: 10.1002/jbm.b.35080. Epub 2022 May 9. J Biomed Mater Res B Appl Biomater. 2022. PMID: 35532208 Free PMC article.
-
Collagen oligomers modulate physical and biological properties of three-dimensional self-assembled matrices.Biopolymers. 2011 Feb;95(2):77-93. doi: 10.1002/bip.21537. Epub 2010 Aug 24. Biopolymers. 2011. PMID: 20740490 Free PMC article.
References
-
- Abraham LC, Zuena E, Perez-Ramirez B, Kaplan DL. J Biomed Mater Res B Appl Biomater. 2008;87B:264–285. - PubMed
-
- Friess W. Eur J Pharm Biopharm. 1998;45:113–136. - PubMed
-
- Griffith LG, Swartz MA. Nat Rev Mol Cell Biol. 2006;7:211–224. - PubMed
-
- Pedersen JA, Swartz MA. Ann Biomed Eng. 2005;33:1469–1490. - PubMed
Publication types
MeSH terms
Substances
Grants and funding
LinkOut - more resources
Full Text Sources
Other Literature Sources
