

Overexpression of dicer as a result of reduced let-7 MicroRNA levels contributes to increased cell proliferation of oral cancer cells
- PMID: 20232482
- PMCID: PMC2859695
- DOI: 10.1002/gcc.20765
Overexpression of dicer as a result of reduced let-7 MicroRNA levels contributes to increased cell proliferation of oral cancer cells
Abstract
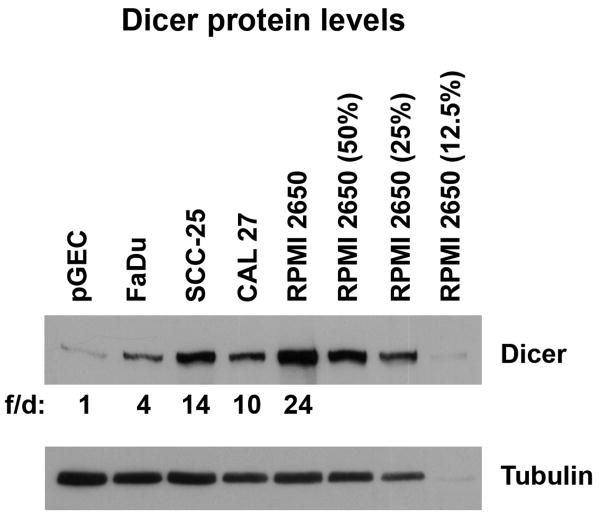
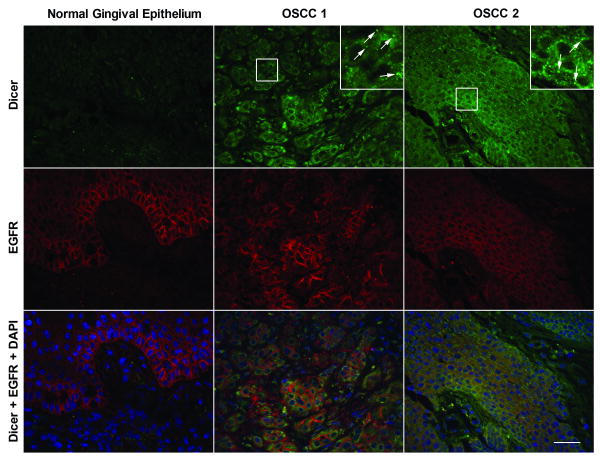
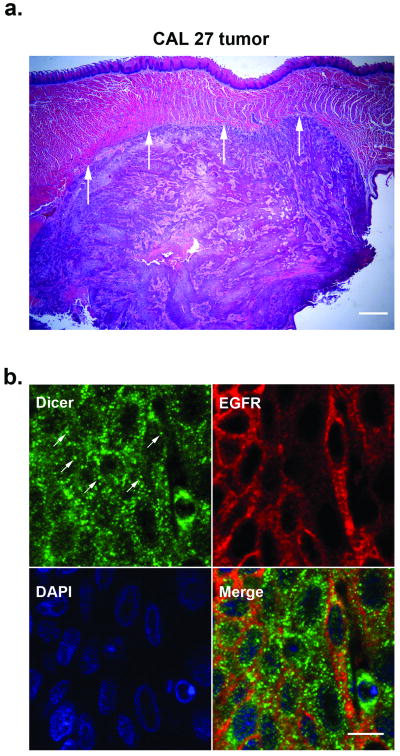
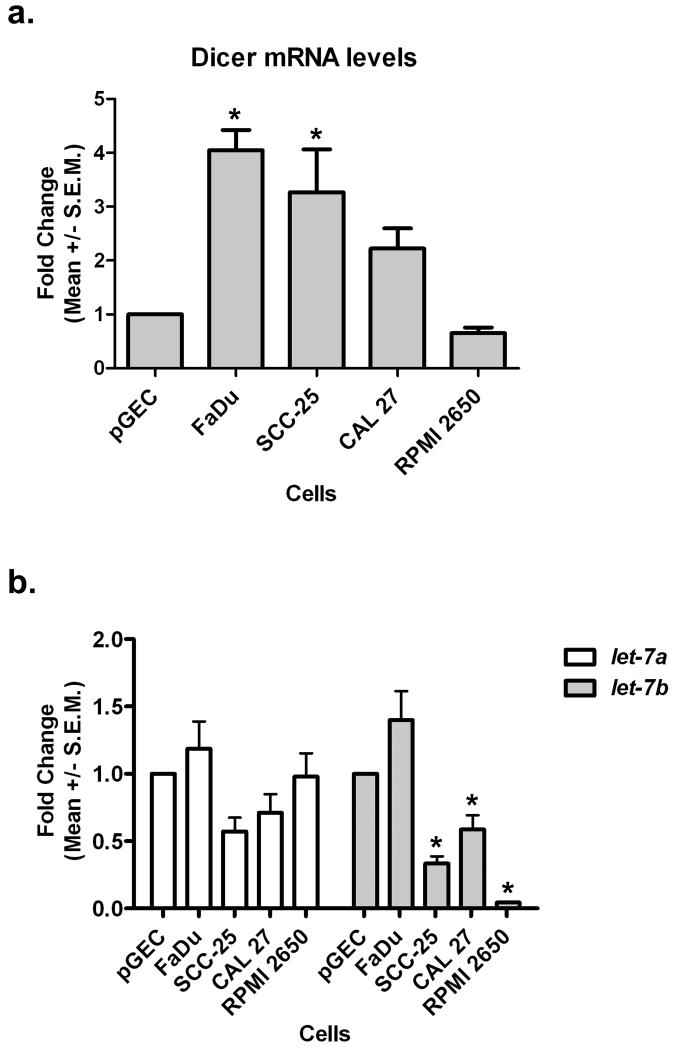
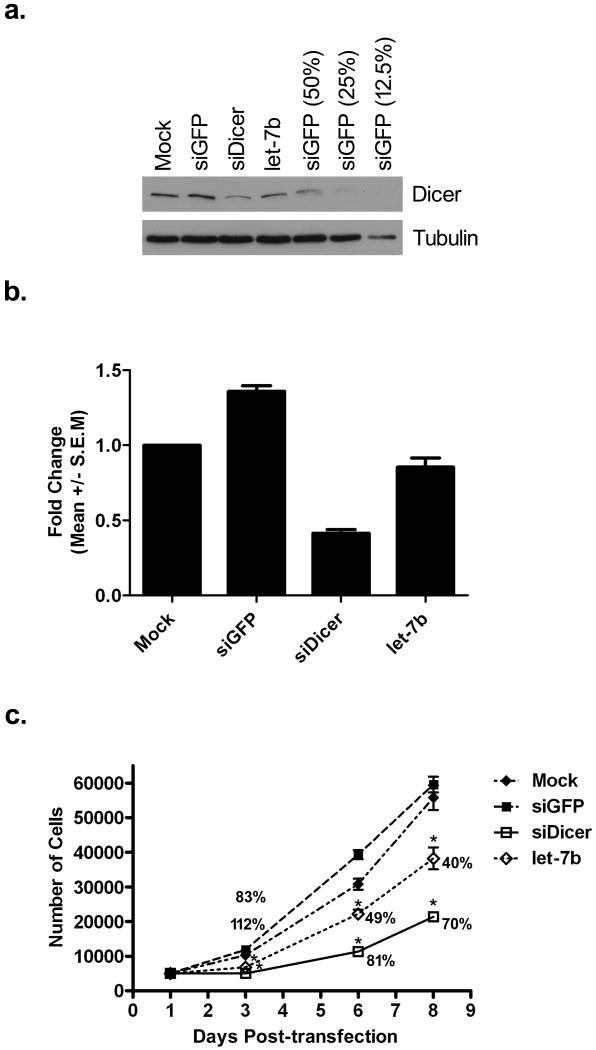
Recent reports have demonstrated that Dicer, an RNase III endonuclease required for microRNA (miRNA) maturation, is aberrantly expressed in different types of cancer. Furthermore, Dicer has been reported to be regulated by the let-7 family of miRNA genes. We hypothesize that Dicer is aberrantly expressed in oral cancer cells due to altered expressions of let-7 and that Dicer contributes to the development and progression of the disease. Western blot examination of Dicer protein levels in four head and neck squamous cell carcinoma (HNSCC) cell lines, including two oral cancer cell lines, demonstrated that Dicer had between 4- and 24-fold higher expression levels when compared to normal human primary gingival epithelial cells. Furthermore, five of six oral cancer tissues analyzed by indirect immunofluorescence had increased Dicer protein expression, compared to normal gingival epithelial tissue. The Dicer mRNA levels were not found to correlate well with protein expression in the HNSCC cell lines, suggesting that Dicer protein expression was post-transcriptionally regulated. Analysis of let-7a and let-7b levels in HNSCC cell lines by real-time PCR demonstrated that let-7b, but not let-7a, was significantly reduced in the HNSCC cell lines compared to control cells. Lastly, transfection of oral cancer cells with chemically synthesized let-7b and small interfering RNAs targeting Dicer significantly inhibited cell proliferation up to 83% and >100%, respectively, as early as 3 days post-transfection. Together, these data demonstrate that elevated expression levels of Dicer in oral cancer cells correlate with downregulation of let-7b and increased cell proliferation.
(c) 2010 Wiley-Liss, Inc.
Figures
Similar articles
-
Epstein-Barr virus EBNA1 protein regulates viral latency through effects on let-7 microRNA and dicer.J Virol. 2014 Oct;88(19):11166-77. doi: 10.1128/JVI.01785-14. Epub 2014 Jul 16. J Virol. 2014. PMID: 25031339 Free PMC article.
-
Silencing Dicer expression enhances cellular proliferative and invasive capacities in human tongue squamous cell carcinoma.Oncol Rep. 2014 Feb;31(2):867-73. doi: 10.3892/or.2013.2903. Epub 2013 Dec 6. Oncol Rep. 2014. PMID: 24317682
-
MicroRNA Let-7a and dicer are important in the activation and implantation of delayed implanting mouse embryos.Hum Reprod. 2014 Apr;29(4):750-62. doi: 10.1093/humrep/det462. Epub 2014 Jan 12. Hum Reprod. 2014. PMID: 24419497
-
The many faces of Dicer: the complexity of the mechanisms regulating Dicer gene expression and enzyme activities.Nucleic Acids Res. 2015 May 19;43(9):4365-80. doi: 10.1093/nar/gkv328. Epub 2015 Apr 16. Nucleic Acids Res. 2015. PMID: 25883138 Free PMC article. Review.
-
Molecular mechanisms of Dicer: endonuclease and enzymatic activity.Biochem J. 2017 May 4;474(10):1603-1618. doi: 10.1042/BCJ20160759. Biochem J. 2017. PMID: 28473628 Free PMC article. Review.
Cited by
-
Dicer and microRNA expression in multiple sclerosis and response to interferon therapy.J Neuroimmunol. 2016 Mar 15;292:68-78. doi: 10.1016/j.jneuroim.2016.01.009. Epub 2016 Jan 21. J Neuroimmunol. 2016. PMID: 26943961 Free PMC article.
-
Epstein-Barr virus EBNA1 protein regulates viral latency through effects on let-7 microRNA and dicer.J Virol. 2014 Oct;88(19):11166-77. doi: 10.1128/JVI.01785-14. Epub 2014 Jul 16. J Virol. 2014. PMID: 25031339 Free PMC article.
-
Novel insights into epigenetic drivers of oropharyngeal squamous cell carcinoma: role of HPV and lifestyle factors.Clin Epigenetics. 2017 Nov 28;9:124. doi: 10.1186/s13148-017-0424-5. eCollection 2017. Clin Epigenetics. 2017. PMID: 29209433 Free PMC article. Review.
-
Aberrant Expression of microRNA Clusters in Head and Neck Cancer Development and Progression: Current and Future Translational Impacts.Pharmaceuticals (Basel). 2021 Feb 27;14(3):194. doi: 10.3390/ph14030194. Pharmaceuticals (Basel). 2021. PMID: 33673471 Free PMC article. Review.
-
IGF-1R, a target of let-7b, mediates crosstalk between IRS-2/Akt and MAPK pathways to promote proliferation of oral squamous cell carcinoma.Oncotarget. 2014 May 15;5(9):2562-74. doi: 10.18632/oncotarget.1812. Oncotarget. 2014. PMID: 24810113 Free PMC article.
References
-
- Abramoff MD, Magelhaes PJ, Ram SJ. Image Processing with ImageJ. Biophotonics Intern. 2004;11:36–42.
-
- Akao Y, Nakagawa Y, Naoe T. let-7 microRNA functions as a potential growth suppressor in human colon cancer cells. Biol Pharm Bull. 2006;29:903–906. - PubMed
-
- Calin GA, Croce CM. MicroRNA signatures in human cancers. Nat Rev Cancer. 2006;6:857–866. - PubMed
Publication types
MeSH terms
Substances
Grants and funding
LinkOut - more resources
Full Text Sources
Other Literature Sources
Medical
