

Effects of transplantation of adipose tissue-derived stem cells on prostate tumor
- PMID: 20232361
- PMCID: PMC2877148
- DOI: 10.1002/pros.21140
Effects of transplantation of adipose tissue-derived stem cells on prostate tumor
Abstract
Background: Obesity is a risk factor for prostate cancer development, but the underlying mechanism is unknown. The present study tested the hypothesis that stromal cells of the adipose tissue might be recruited by cancer cells to help tumor growth.
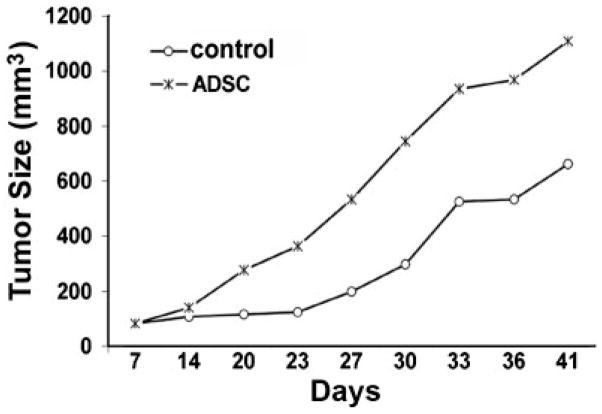
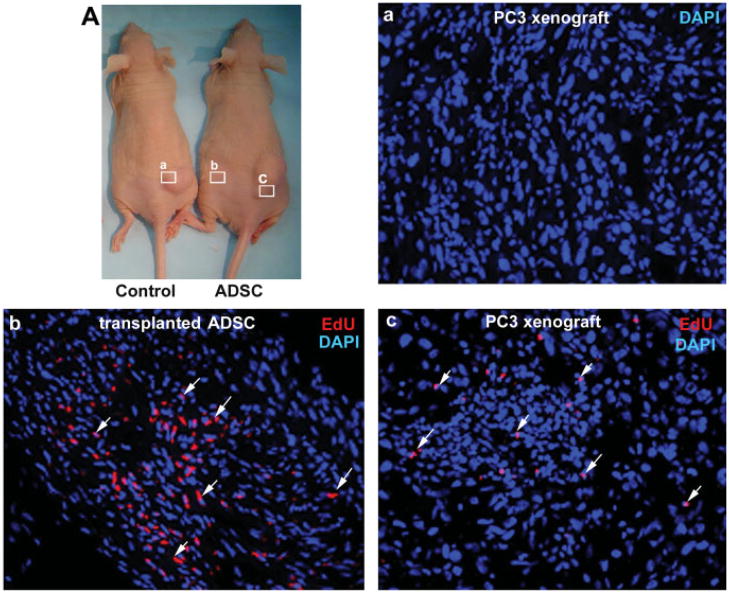
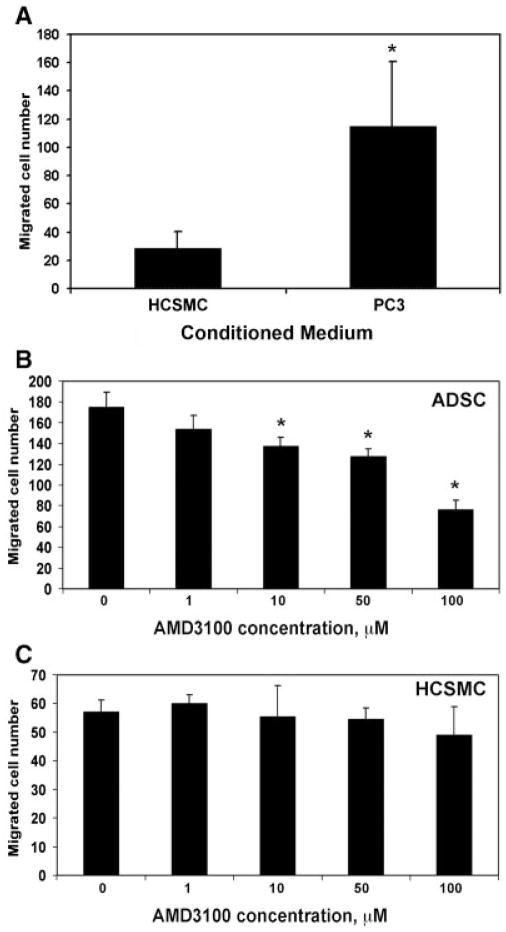
Methods: PC3 prostate cancer cells were transplanted into the subcutaneous space of the right flank of athymic mice. One week later, adipose tissue-derived stromal or stem cells (ADSC) or phosphate-buffered saline (PBS, as control) was transplanted similarly to the left flank. Tumor size was monitored for the next 34 days; afterwards, the mice were sacrificed and their tumors harvested for histological examination. The ability of PC3 cells to attract ADSC was tested by migration assay. The involvement of the CXCL12/CXCR4 axis was tested by migration assay in the presence of a specific inhibitor AMD3100.
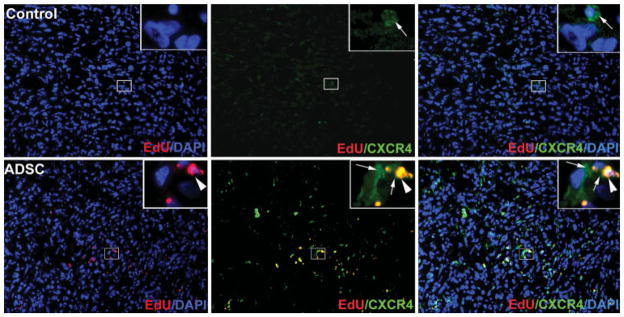
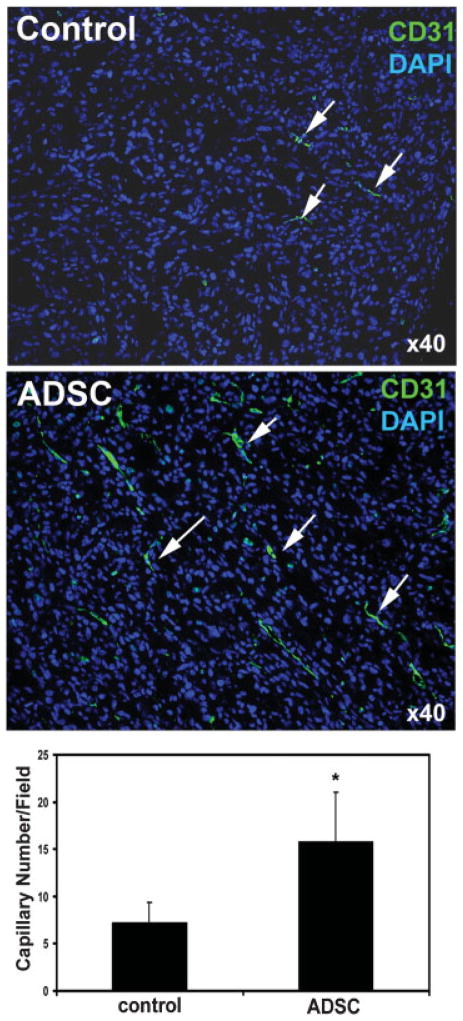
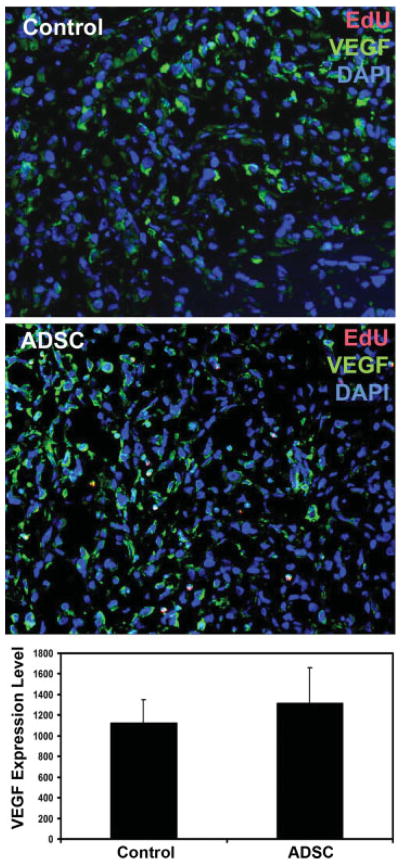
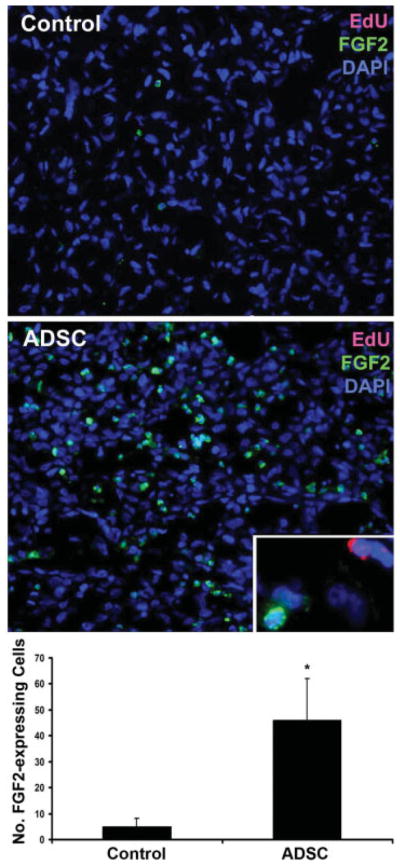
Results: Throughout the entire course, the average size of PC3 tumors in ADSC-treated mice was larger than in PBS-treated mice. ADSC were identified inside the tumors of ADSC-treated mice; CXCR4 expression was also detected. Migration assay indicated the involvement of the CXCL12/CXCR4 axis in the migration of ADSC toward PC3 cells. Capillary density was twice as high in the tumors of ADSC-treated mice than in the tumors of PBS-treated mice. VEGF expression was similar but FGF2 expression was significantly higher in tumors of ADSC-treated mice than in the tumors of PBS-tread mice.
Conclusion: Prostate cancer cells recruited ADSC by the CXCL12/CXCR4 axis. ADSC helps tumor growth by increasing tumor vascularity, and which was mediated by FGF2.
Figures
Similar articles
-
CXCR4 pharmacogical inhibition reduces bone and soft tissue metastatic burden by affecting tumor growth and tumorigenic potential in prostate cancer preclinical models.Prostate. 2015 Sep;75(12):1227-46. doi: 10.1002/pros.23007. Epub 2015 Jun 12. Prostate. 2015. PMID: 26073897
-
CXCR4 inhibition with AMD3100 sensitizes prostate cancer to docetaxel chemotherapy.Neoplasia. 2012 Aug;14(8):709-18. doi: 10.1593/neo.12324. Neoplasia. 2012. PMID: 22952424 Free PMC article.
-
Proinflammatory CXCL12-CXCR4/CXCR7 Signaling Axis Drives Myc-Induced Prostate Cancer in Obese Mice.Cancer Res. 2017 Sep 15;77(18):5158-5168. doi: 10.1158/0008-5472.CAN-17-0284. Epub 2017 Jul 7. Cancer Res. 2017. PMID: 28687617 Free PMC article.
-
AMD3100 inhibits epithelial-mesenchymal transition, cell invasion, and metastasis in the liver and the lung through blocking the SDF-1α/CXCR4 signaling pathway in prostate cancer.J Cell Physiol. 2019 Jul;234(7):11746-11759. doi: 10.1002/jcp.27831. Epub 2018 Dec 7. J Cell Physiol. 2019. PMID: 30537000
-
The CXCR4/SDF-1 chemokine axis: a potential therapeutic target for bone metastases?Curr Pharm Des. 2010;16(11):1284-90. doi: 10.2174/138161210791034012. Curr Pharm Des. 2010. PMID: 20166978 Review.
Cited by
-
Adipose tissue-derived stem cells promote prostate tumor growth.Prostate. 2010 Nov 1;70(15):1709-15. doi: 10.1002/pros.21206. Prostate. 2010. PMID: 20564322 Free PMC article.
-
Adipose tissue-derived stem cells ameliorate diabetic bladder dysfunction in a type II diabetic rat model.Stem Cells Dev. 2012 Jun 10;21(9):1391-400. doi: 10.1089/scd.2011.0244. Epub 2011 Oct 18. Stem Cells Dev. 2012. PMID: 22008016 Free PMC article.
-
Human adipose-derived stem cells for the treatment of intracerebral hemorrhage in rats via femoral intravenous injection.Cell Mol Biol Lett. 2012 Sep;17(3):376-92. doi: 10.2478/s11658-012-0016-5. Epub 2012 Apr 28. Cell Mol Biol Lett. 2012. PMID: 22544763 Free PMC article.
-
Mesenchymal stem cells in acute myeloid leukemia: a focus on mechanisms involved and therapeutic concepts.Blood Res. 2019 Sep;54(3):165-174. doi: 10.5045/br.2019.54.3.165. Epub 2019 Sep 25. Blood Res. 2019. PMID: 31730689 Free PMC article. Review.
-
Non-glycanated Decorin Is a Drug Target on Human Adipose Stromal Cells.Mol Ther Oncolytics. 2017 May 17;6:1-9. doi: 10.1016/j.omto.2017.05.003. eCollection 2017 Sep 15. Mol Ther Oncolytics. 2017. PMID: 28607949 Free PMC article.
References
-
- Rodriguez C, Freedland SJ, Deka A, Jacobs EJ, McCullough ML, Patel AV, Thun MJ, Calle EE. Body mass index, weight change, and risk of prostate cancer in the Cancer Prevention Study II Nutrition Cohort. Cancer Epidemiol Biomarkers Prev. 2007;16(1):63–69. - PubMed
-
- Park JH, Cho BL, Kwon HT, Lee CM, Han HJ. Effect of body mass index and waist circumference on prostate specific antigen and prostate volume in a generally healthy Korean population. J Urol. 2009;182(1):106–110. discussion 110–101. - PubMed
-
- Freedland SJ, Banez LL, Sun LL, Fitzsimons NJ, Moul JW. Obese men have higher-grade and larger tumors: An analysis of the duke prostate center database. Prostate Cancer Prostatic Dis. 2009;12(3):259–263. - PubMed
-
- Muehlberg FL, Song YH, Krohn A, Pinilla SP, Droll LH, Leng X, Seidensticker M, Ricke J, Altman AM, Devarajan E, Liu W, Arlinghaus RB, Alt EU. Tissue-resident stem cells promote breast cancer growth and metastasis. Carcinogenesis. 2009;30(4):589–597. - PubMed
Publication types
MeSH terms
Substances
Grants and funding
LinkOut - more resources
Full Text Sources
Medical
