

Caloric restriction leads to high marrow adiposity and low bone mass in growing mice
- PMID: 20229598
- PMCID: PMC3127399
- DOI: 10.1002/jbmr.82
Caloric restriction leads to high marrow adiposity and low bone mass in growing mice
Abstract
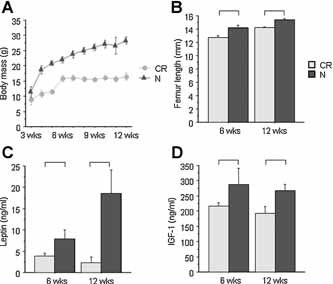
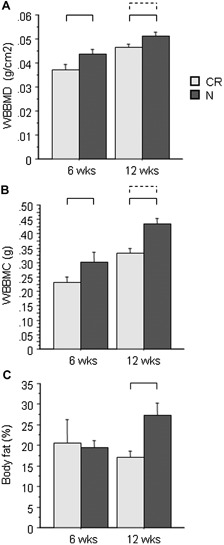
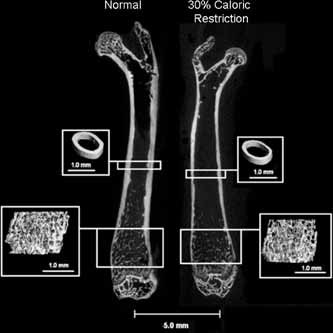
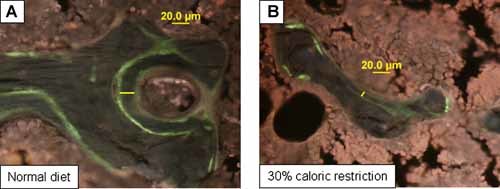
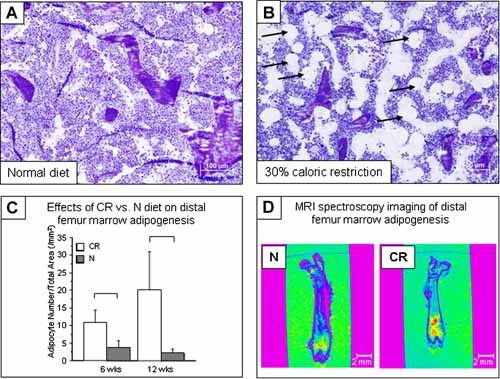
The effects of caloric restriction (CR) on the skeleton are well studied in adult rodents and include lower cortical bone mass but higher trabecular bone volume. Much less is known about how CR affects bone mass in young, rapidly growing animals. This is an important problem because low caloric intake during skeletal acquisition in humans, as in anorexia nervosa, is associated with low bone mass, increased fracture risk, and osteoporosis in adulthood. To explore this question, we tested the effect of caloric restriction on bone mass and microarchitecture during rapid skeletal growth in young mice. At 3 weeks of age, we weaned male C57Bl/6J mice onto 30% caloric restriction (10% kcal/fat) or normal diet (10% kcal/fat). Outcomes at 6 (n = 4/group) and 12 weeks of age (n = 8/group) included body mass, femur length, serum leptin and insulin-like growth factor 1 (IGF-1) values, whole-body bone mineral density (WBBMD, g/cm(2)), cortical and trabecular bone architecture at the midshaft and distal femur, bone formation and cellularity, and marrow fat measurement. Compared with the normal diet, CR mice had 52% and 88% lower serum leptin and 33% and 39% lower serum IGF-1 at 6 and 12 weeks of age (p < .05 for all). CR mice were smaller, with lower bone mineral density, trabecular, and cortical bone properties. Bone-formation indices were lower, whereas bone-resorption indices were higher (p < .01 for all) in CR versus normal diet mice. Despite having lower percent of body fat, bone marrow adiposity was elevated dramatically in CR versus normal diet mice (p < .05). Thus we conclude that caloric restriction in young, growing mice is associated with impaired skeletal acquisition, low leptin and IGF-1 levels, and high marrow adiposity. These results support the hypothesis that caloric restriction during rapid skeletal growth is deleterious to cortical and trabecular bone mass and architecture, in contrast to potential skeletal benefits of CR in aging animals.
© 2010 American Society for Bone and Mineral Research.
Figures
Similar articles
-
Daily leptin blunts marrow fat but does not impact bone mass in calorie-restricted mice.J Endocrinol. 2016 Jun;229(3):295-306. doi: 10.1530/JOE-15-0473. J Endocrinol. 2016. PMID: 27340200 Free PMC article.
-
Caloric restriction decreases cortical bone mass but spares trabecular bone in the mouse skeleton: implications for the regulation of bone mass by body weight.J Bone Miner Res. 2008 Jun;23(6):870-8. doi: 10.1359/jbmr.080213. J Bone Miner Res. 2008. PMID: 18435579
-
Differential effects of high fat diet and diet-induced obesity on skeletal acquisition in female C57BL/6J vs. FVB/NJ Mice.Bone Rep. 2018 Apr 19;8:204-214. doi: 10.1016/j.bonr.2018.04.003. eCollection 2018 Jun. Bone Rep. 2018. PMID: 29955639 Free PMC article.
-
Dietary restrictions, bone density, and bone quality.Ann N Y Acad Sci. 2016 Jan;1363:26-39. doi: 10.1111/nyas.13004. Epub 2016 Feb 16. Ann N Y Acad Sci. 2016. PMID: 26881697 Review.
-
The effects of popular diets on bone health in the past decade: a narrative review.Front Endocrinol (Lausanne). 2024 Mar 26;14:1287140. doi: 10.3389/fendo.2023.1287140. eCollection 2023. Front Endocrinol (Lausanne). 2024. PMID: 38665424 Free PMC article. Review.
Cited by
-
A High Fat Diet Increases Bone Marrow Adipose Tissue (MAT) But Does Not Alter Trabecular or Cortical Bone Mass in C57BL/6J Mice.J Cell Physiol. 2015 Sep;230(9):2032-7. doi: 10.1002/jcp.24954. J Cell Physiol. 2015. PMID: 25663195 Free PMC article.
-
Disrupted mitochondrial function in the Opa3L122P mouse model for Costeff Syndrome impairs skeletal integrity.Hum Mol Genet. 2016 Jun 15;25(12):2404-2416. doi: 10.1093/hmg/ddw107. Epub 2016 Apr 22. Hum Mol Genet. 2016. PMID: 27106103 Free PMC article.
-
Moderate weight gain does not influence bone metabolism in skeletally mature female rats.Bone. 2010 Sep;47(3):631-5. doi: 10.1016/j.bone.2010.06.010. Epub 2010 Jun 19. Bone. 2010. PMID: 20601291 Free PMC article.
-
The benefits of adipocyte metabolism in bone health and regeneration.Front Cell Dev Biol. 2023 Feb 21;11:1104709. doi: 10.3389/fcell.2023.1104709. eCollection 2023. Front Cell Dev Biol. 2023. PMID: 36895792 Free PMC article. Review.
-
Bone Marrow Adipocytes: The Enigmatic Components of the Hematopoietic Stem Cell Niche.J Clin Med. 2019 May 18;8(5):707. doi: 10.3390/jcm8050707. J Clin Med. 2019. PMID: 31109063 Free PMC article. Review.
References
-
- Seeman E. Reduced bone density in women with fractures: contribution of low peak bone density and rapid bone loss. Osteoporos Int. 1994; 4: S15–25. - PubMed
-
- Hui SL, Slemenda CW, Johnston CC Jr. The contribution of bone loss to postmenopausal osteoporosis. Osteoporos Int. 1990; 1: 30–34. - PubMed
-
- Bonjour JP, Chevalley T, Rizzoli R, Ferrari S. Gene‐environment interactions in the skeletal response to nutrition and exercise during growth. Med Sport Sci. 2007; 51: 64–80. - PubMed
-
- Bailey DA. The Saskatchewan Pediatric Bone Mineral Accrual Study: bone mineral acquisition during the growing years. Int J Sports Med. 1997; 18: S191–194. - PubMed
-
- Bonjour JP, Theintz G, Buchs B, Slosman D, Rizzoli R. Critical years and stages of puberty for spinal and femoral bone mass accumulation during adolescence. J Clin Endocrinol Metab. 1991; 73: 555–563. - PubMed
Publication types
MeSH terms
Grants and funding
LinkOut - more resources
Full Text Sources
Other Literature Sources
Miscellaneous
