. 2010 Apr;12(4):330-40.
doi: 10.1038/ncb2034. Epub 2010 Mar 14.

Protein complexes containing CYFIP/Sra/PIR121 coordinate Arf1 and Rac1 signalling during clathrin-AP-1-coated carrier biogenesis at the TGN

Affiliations

Protein complexes containing CYFIP/Sra/PIR121 coordinate Arf1 and Rac1 signalling during clathrin-AP-1-coated carrier biogenesis at the TGN

Mihaela Anitei et al. Nat Cell Biol. 2010 Apr.

Erratum in

  • Nat Cell Biol. 2010 May;12(5):520

Abstract

Actin dynamics is a tightly regulated process involved in various cellular events including biogenesis of clathrin-coated, AP-1 (adaptor protein 1)-coated transport carriers connecting the trans-Golgi network (TGN) and the endocytic pathway. However, the mechanisms coordinating coat assembly, membrane and actin remodelling during post-TGN transport remain poorly understood. Here we show that the Arf1 (ADP-ribosylation factor 1) GTPase synchronizes the TGN association of clathrin-AP-1 coats and protein complexes comprising CYFIP (cytoplasmic fragile-X mental retardation interacting protein; Sra, PIR121), a clathrin heavy chain binding protein associated with mental retardation. The Rac1 GTPase and its exchange factor beta-PIX (PAK-interacting exchange factor) activate these complexes, allowing N-WASP-dependent and Arp2/3-dependent actin polymerization towards membranes, thus promoting tubule formation. These phenomena can be recapitulated with synthetic membranes. This protein-network-based mechanism facilitates the sequential coordination of Arf1-dependent membrane priming, through the recruitment of coats and CYFIP-containing complexes, and of Rac1-dependent actin polymerization, and provides complementary but independent levels of regulation during early stages of clathrin-AP1-coated carrier biogenesis.


Conflict of interest statement

The authors declare that they have no competing financial interests.

Figures
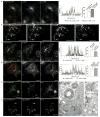
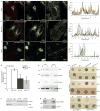
Figure 1
Figure 1. Localization of CYFIP1 and CYFIP2
(a, b) BSC-1 cells stably expressing clathrin light chain (CLC)-EGFP were labeled with antibodies against CYFIP1 (red) and (b) P21-Arc (blue). (c, d) HeLa cells were labeled with antibodies against CYFIP1 (red) and (c) AP-1γ (green) or (d) transferrin receptor (green). (e, f) HeLa cells transiently expressing myc-tagged CYFIP2 were labeled with antibodies against myc, (e) clathrin heavy chain (CHC, green) or (f) AP-1γ (red). Co-localization was analyzed and quantified with Volocity 5.2 software. R represents the overlap coefficients, Rr the Pearson correlation coefficients. Data is presented as mean ± s.d. (in each case, 20 – 25 cells from n= 3 different experiments). Scale bars, (a, c-f) 10 μm, (b) 5 μm. (g-k) HeLa cells transiently expressing myc-tagged CYFIP2 were processed for electron microscopy. Thawed cryosections were co-labeled with anti-AP-1 (15 nm gold particles) and anti-myc antibodies (10 nm gold particles). (g, h) Arrows indicate AP-1 present on myc-tagged CYFIP2 enlarged intracellular structures, or (i-k) AP-1 and CYFIP2 co-localization on intracellular membranes.
Figure 2
Figure 2. CYFIP1 and CYFIP2 interact with CHC and CYFIP1 recruitment to the TGN is regulated by ARF1
(a-d) HeLa cells stably expressing GFP-MPR were treated with (a) control siRNA or (c) siRNAs to deplete CHC or (b) incubated with 5 μg ml−1 BFA for 15 min. Cells were then labeled with anti-CYFIP1 (red), and (d) the overlap (R) and Pearson correlation (Rr) coefficients between GFP-MPR and CYFIP1 in the TGN region were quantified for each condition (20 cells from n = 3 independent experiments were analyzed per condition; data represent the mean ± s.d.). Scale bars, 10 μm. (e) The membrane (M) and cytosolic (C) fractions of HeLa cells incubated either with siNon or with siCHC were analyzed by western blot (n = 3 independent experiments). (f) COS-7 cell lysates were incubated with anti-CYFIP1 or with control pre-immune rabbit IgG. Beads were washed with buffer with or without 0.5 M TrisHCl (pH 7.4), which induces clathrin cage depolymerization. The presence of CHC and CYFIP1 in the immunoprecipitates was determined by western blotting using the corresponding antibodies. CHC was co-immunoprecipitated with CYFIP1 only in the absence of TrisHCl (n = 3 independent experiments). (g) Lysates of HeLa cells transiently expressing myc-tagged CYFIP2 were incubated with anti-myc or control mouse IgGs and the immunoprecipitates were analyzed by western blotting. Full scans of all gels are shown in Supplementary Information, Fig. S9. (h) The N-terminal (AD-CYFIP2-N, AA 2–623) and the C-terminal domains C (AD-CYFIP2-C, AA 674–1299) of CYFIP2 were expressed as fusions with GAL4AD (pGADT7). The N-terminal (BD-CLC-N, AA 1–690) and the C-terminal (BD-CLC-C, AA 821–1679) halves of clathrin heavy chain, as well as (i) full-length Nap1 were fused to the DNA-BD (pGBKT7), and co-expressed with the GAL4AD containing plasmids. Interactions were detected by growth on agar plates lacking leucine and tryptophane (SD-2), or adenine, histidine, leucine and tryptophane (SD-4). Plasmids expressing either fusion of lamin C to the DNA-BD (BD-Lam) or DNA-BD alone (BD) were used as negative controls. N = 3 independent experiments.
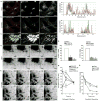
Figure 3
Figure 3. RAC1 and β-PIX control the recruitment of P21-Arc but not CYFIP1 to the TGN
GFP-MPR expressing HeLa cells incubated with the indicated siRNAs were labeled with (a) anti-CYFIP1 (red) and anti-P21-Arc (blue), (b) anti-RAC1 (red) or anti-AP-1γ (red) and examined by confocal microscopy. 20–25 cells from n = 3 independent experiments were analyzed in each case. Scale bars, 10μm.
Figure 4
Figure 4. CYFIP2 depletion disrupts organelle integrity and decreases transport carrier biogenesis
GFP-MPR expressing HeLa cells were treated with control siRNAs or with siRNAs targeting CYFIP2 or CYFIP1. (a) Cells were labeled with anti-P21-Arc (red) and co-localization between GFP-MPR and P21-Arc in the TGN region was analyzed. 20 cells from n = 3 independent experiments were analyzed for each condition. (c) Confocal fluorescence analysis indicated that CYFIP1 localized along GFP-MPR tubules (n = 20 cells). Scale bars, 10 μm. (d) The levels of CYFIP1 and CYFIP2 mRNAs following the indicated knock-downs were measured by Q RT-PCR; GAPDH was used as a control (n = 4 independent experiments; data represent the mean ± s.d.). (e, f) Cells were examined by time-lapse videomicroscopy. The number of GFP-MPR positive tubules exiting from the GFP-MPR rich compartment was analyzed as shown in Table I. Scale bars, 2 μm. (g) HeLa cells were labeled with 35S Methionine for 30 min, then pulse-chased for the indicated times. Cathepsin D was immunoprecipitated from the lysates and analyzed by SDS-PAGE. The relative levels of the precursor (P) and intermediate (I) forms were quantified relative to the total Cathepsin D levels (n = 3 independent experiments; data represent the mean ± s.d.). (h) For measuring Tfn recycling, cells were starved for 1 h, then incubated with fluorescent-labeled Tfn for 1h, and chased at 37°C in the presence of unlabeled Tfn for the indicated times. The amount of intracellular labeled Tfn was measured by fluorescence microscopy and quantified using ImageJ (n = 3 independent experiments for siNon and siCYFIP2; data represent the mean ± s.d.).
Figure 5
Figure 5. Reconstitution of clathrin-, AP-1-coated carrier biogenesis on model membranes
(a) DiI C18 labeled giant unilamellar vesicles (GUVs), alone, or containing only PI-4P, only GpI cytoplasmic domains, or both GpI tails and PI-4P, or PI-4P and the GpI cytoplasmic domain devoid of sorting signals (GpIcdΔ), were incubated in the presence of GTP-γ-S with porcine brain cytosol spiked with cytosol of CLC-EGFP expressing cells. They were then imaged by confocal microscopy and (b) CLC-EGFP intensities were determined (n = 3 independent experiments; data represent the mean ± s.d.; pPI4P/no PI4P = 0.386, ≥ 7 GUVs per condition; pGpI/no GpI (no PI4P) = 9.88 × 10⁻⁹, 10GUVs per condition; pGpI/no GpI (with PI4P) = 2.18×10⁻⁷, 7 GUVs per condition; pGpI + PI4P/GpI (no PI4P) = 0.088, ≥ 7 GUVs per condition; pGpI/GpIcdΔ (with PI4P) = 2.5×10⁻²³; ≥ 43 GUVs per condition; Anova single factor analysis). (c–e) DiD C18- labeled GUVs with GpI cytplasmic domains and PI-4P were incubated in the presence of GTP-γ-S and porcine brain cytosol spiked with a mixture of cytosols from cells expressing dTomato-CLC and EGFP-AP-1σ or GFP-CYFIP1. The samples were imaged by confocal microscopy. (f) GUVs with GpI tails and PI-4P were incubated, as in C, with an ATP regenerating system, in the absence (left panels) or the presence of 50 μM Latrunculin B (25 min) (right panels). (g) DiI C18-labeled GUVs with GpI tails and PI-4P were incubated with cytosols of EGFP-actin expressing HEK cells treated with the indicated siRNAs or with 100 nM RAC1 inhibitor (NSC23766). Actin polymerization and tubule formation were analyzed by confocal microscopy, and the number of GUVs displaying EGFP-actin tubes is shown as a percentage of the total DiI C18-positive GUVs (n = 3 independent experiments for siRNA-treated cells and n = 5 independent experiments for Rac1 inhibitor; data represent the mean ± s.d.; > 250 GUVs were analysed per condition; psiCYFIP1 = 0.02, psiRAC1 = 0.0017 compared with control siNon; pRac1 inhibitor = 0.002 compared to control cells; Anova single factor analysis). (h) DiD C18-labeled GUVs with GpI cytoplasmic domains and PI-4P were incubated at 37°C in the presence of GTP-γ-S and porcine brain cytosol spiked with cytosol from RFP-actin expressing HEK cells. After 15 min, cytosol from EGFP-actin expressing cells was added, and the GUVs were incubated for 10 additional min and analyzed by confocal microscopy. Scale bars: 10 μm.
Figure 6
Figure 6. Model of clathrin-, AP-1-coated carrier biogenesis
(a) ARF1 activation triggers the recruitment of AP-1 and clathrin onto TGN membranes leading to cargo sorting. The CYFIP, ABI, NAP1 complex is recruited at the edges of the clathrin-, AP-1 coated subdomains of the TGN. HIP1R binding to clathrin light chains could prevent actin polymerization on the surface of clathrin coats. (b) RAC1, activated by its GEF β-PIX, which forms a complex with the ARF1-GAP GIT1 and/or GIT2, binds to CYFIP and activates the actin nucleation complex leading to N-WASP-dependent activation of ARP2/3 and actin polymerization towards the TGN membrane during the initial stages of tubular carrier formation. (c) BAR domain proteins, dynamin2 and cortactin bind to tubular membranes. These molecules can bind N-WASP and thus sustain ARP2/3-dependent actin polymerization during tubule elongation and fission.

Similar articles

Cited by

References

    1. Ghosh P, Dahms NM, Kornfeld S. Mannose 6-phosphate receptors: new twists in the tale. Nat Rev Mol Cell Biol. 2003;4:202–12. - PubMed
    1. Edeling MA, Smith C, Owen D. Life of a clathrin coat: insights from clathrin and AP structures. Nat Rev Mol Cell Biol. 2006;7:32–44. - PubMed
    1. Bonifacino JS, Glick BS. The mechanisms of vesicle budding and fusion. Cell. 2004;116:153–66. - PubMed
    1. Godi A, et al. ARF mediates recruitment of PtdIns-4-OH kinase-beta and stimulates synthesis of PtdIns(4,5)P2 on the Golgi complex. Nat Cell Biol. 1999;1:280–7. - PubMed
    1. D’Souza-Schorey C, Chavrier P. ARF proteins: roles in membrane traffic and beyond. Nat Rev Mol Cell Biol. 2006;7:347–58. - PubMed

Publication types

MeSH terms

Substances