. 2010 May 14;285(20):15566-15576.
doi: 10.1074/jbc.M110.103408. Epub 2010 Mar 12.

CXC chemokine receptor 4 is a cell surface receptor for extracellular ubiquitin

Affiliations

CXC chemokine receptor 4 is a cell surface receptor for extracellular ubiquitin

Vikas Saini et al. J Biol Chem. .

Abstract

Ubiquitin is one of the most highly conserved proteins in eukaryotes and plays major biological roles as a post-translational protein modifier. Ubiquitin is also a natural constituent of plasma, and several lines of evidence suggest that extracellular ubiquitin is an immune modulator with anti-inflammatory properties. In addition, ubiquitin treatment has been shown to limit inflammation and reduce organ injury in various disease models and species in vivo. However, its mechanism of action is unknown. Here we show that extracellular ubiquitin is a natural CXC chemokine receptor 4 (CXCR4 and CD184) agonist. Extracellular ubiquitin promotes intracellular Ca(2+) flux and reduces cAMP levels through a G protein-coupled receptor that signals via a Galpha(i/o) protein in THP1 cells. Toll-like receptor 4 stimulation reduces ubiquitin-binding sites, which enabled identification of four Galpha(i/o) PCRs as ubiquitin receptor candidates. Overexpression of candidate genes in HEK293 cells, gene silencing in THP1 cells, competition binding, and signaling studies with the CXCR4 agonist stromal cell-derived factor-1alpha (chemokine (CXC motif) ligand 12) and inhibitor AMD3100 identify CXCR4 as a functional ubiquitin receptor. Our finding uncovers a fundamentally new aspect of the role of ubiquitin in biology, has implications for the understanding of CXCR4-mediated events, and is expected to facilitate development of new therapeutic avenues for a variety of diseases.


Figures

FIGURE 1.
FIGURE 1.
Extracellular ubiquitin binds to monocytes/macrophages at 4 °C. A, FACS analyses of THP1 cells after incubation with FITC-ubiquitin (top panels) or FITC-ovalbumin (bottom panels) for 1 h at 37 °C and 4 °C. Unstained cells are shown in gray, and cells after incubation with FITC-proteins are shown in red. FITC-Ub, FITC-labeled ubiquitin. FITC-Ov, FITC-labeled ovalbumin. Both FITC-labeled proteins showed comparable fluorescence signals/mol of protein. B, fluorescence microscopy of THP1 cells after incubation with 2.9 μm FITC-ubiquitin (FITC-Ub) or FITC-ovalbumin (FITC-Ov) for 1 h at 37 and 4 °C. Green, FITC signal; blue, DAPI nuclear counterstaining. Both FITC-labeled proteins showed comparable fluorescence signals per mol of protein. C, FACS analyses of multiple monocyte/macrophage cell lines and freshly isolated human monocytes (Mo) after incubation with FITC-ubiquitin (red) for 1h at 4 °C. Unstained cells are shown in gray.
FIGURE 2.
FIGURE 2.
Extracellular ubiquitin binds to a cell surface receptor. RFU, relative fluorescence units. A, THP1 cells were incubated with 1.16 μm (10 μg/ml) FITC-ubiquitin for 60 min at 37 °C and washed twice. Fluorescence was measured by flow cytometry (left ordinate, gray circles) and with a fluorescence reader (right ordinate, open circles). Both measurements correlated linear with r2 = 0.977. B, THP1 cells were incubated with 1.16 μm FITC-ubiquitin (■) or FITC-ovalbumin (□) for 0–60 min at 4 °C and washed twice, and the fluorescence signals were measured. Both FITC-labeled proteins showed comparable fluorescence signals/mol of protein. Note that cells were centrifuged for 5 min to remove free FITC-ubiquitin in the cell culture supernatant. Thus, the shortest incubation period equals 5 min exposure to FITC-ubiquitin. n = 3–4. C, confocal fluorescence microscopy of THP1 cells after incubation with FITC-ubiquitin (1.16 μm). Green, FITC-ubiquitin; blue, DAPI nuclear counterstaining. Left panel, incubation with FITC-ubiquitin for 60 min at 37 °C. Right panel, THP1 cells were preincubated with nocodazole and then incubated with FITC-ubiquitin for 1 min at 4 °C. D, FITC-ubiquitin binding to THP1 cells (1 min, 4 °C). The cells were preincubated with nocodazole. ●, FITC-ubiquitin (n = 6). formula image, biotin-ubiquitin (right ordinate; n = 3). ▵, FITC-SUMO1 (n = 5). ◇, FITC-SUMO2 (n = 5). □, FITC-ovalbumin (n = 3). ○, nonspecific binding (n = 6). Dashed line, specific binding curve. E, competition binding (1 min, 4 °C) curve for unlabeled ubiquitin (n = 6, ●) and ovalbumin (n = 3, □) with 1.16 μm FITC-ubiquitin. FITC-ubiquitin binding is expressed as the percentage of the fluorescence signal measured in the absence of unlabeled ubiquitin (100%). F, association and dissociation binding kinetics. For association binding studies THP1 cells were preincubated with nocodazole and then exposed to 1.16 μm FITC-ubiquitin (■, n = 5) or FITC-ovalbumin (□, n = 3, control) for 0–60 min at 4 °C. For dissociation binding studies, THP1 cells were incubated with 1.16 μm FITC-ubiquitin for 1 min at 4 °C. The cells were then washed and incubated for 0–60 min at 37 °C (○, n = 3) or 4 °C (●, nocodazole pretreatment, n = 3). FITC-ubiquitin binding is expressed as percentage of RFU measured at t = 0 min (100%) in dissociation binding studies (right ordinate).
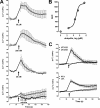
FIGURE 3.
FIGURE 3.
Ubiquitin signals through a Gαi/o heterotrimeric G protein. RFU, relative fluorescence units. A, ubiquitin (0–30 μm)-induced Ca2+ flux in THP1 cells. n = 3. The arrows indicate the time point when ubiquitin (○) or vehicle (■) was added. B, quantification of the ubiquitin-induced Ca2+ signal from A. AUC, area under the fluorescence curves. C, inhibition of the ubiquitin (1–10 μm)-induced Ca2+ signal by U73122 (10 μm) and pertussis toxin (100 ng/ml). The weak PLC inhibitor U73343 (10 μm) was used as a negative control for U73122. n = 3. The arrows indicate the time point when ubiquitin was added.
FIGURE 4.
FIGURE 4.
TLR4 stimulation reduces ubiquitin receptor-binding sites. A, FITC-ubiquitin binding (1 min, 4 °C, nocodazole pretreatment) after incubation of THP1 cells with TLR agonists (2 h, 37 °C). □, TLR2; ■, TLR4; ▵, TLR9; ▿, TLR9 control (ctrl); ○, no TLR stimulation (n = 3–5). B, Bmax values calculated from binding curves in A. *, p < 0.05 versus all other conditions. C, competition binding curve for unlabeled ubiquitin (○), TLR2 (LTA, □), and TLR4 (LPS, ■) agonists with 1.16 μm FITC-ubiquitin. n = 3. FITC-ubiquitin binding is expressed as a percentage of the fluorescence signal measured in the absence of unlabeled ubiquitin or TLR agonists (100%).
FIGURE 5.
FIGURE 5.
Ubiquitin receptor binding is increased in CXCR4 overexpressing cells. RFU, relative fluorescence units. FITC-ubiquitin binding (1 min, 4 °C) was assessed in nocodazole pretreated cells. A, Myc-tagged candidate receptors were transfected into HEK293 cells followed by immunoblotting of whole cell lysates with anti-Myc and anti-β-actin. B, quantification of candidate receptor expression by flow cytometry after transfection as in A. Thick lines, anti-GPCRs. Thin lines, control. Gray, unstained cells. Red, transfected with the GPCRs. Black, transfected with empty plasmid. C, FITC-ubiquitin binding after transfection as in A and B. NSB, nonspecific binding. n = 5. D, FITC-ubiquitin binding to HEK293-CXCR4stable. NSB, nonspecific binding. n = 4. E, competition binding curve for unlabeled ubiquitin in HEK293-CXCR4stable; 1.16 μm FITC-ubiquitin. n = 3. FITC-ubiquitin binding is expressed as a percentage of the fluorescence signal measured in the absence of unlabeled ubiquitin (100%).
FIGURE 6.
FIGURE 6.
Ubiquitin receptor binding is reduced after CXCR4 gene silencing and CXCR4 ligands compete with ubiquitin for receptor-binding sites. A, CXCR4 was silenced with siRNA in THP1 cells followed by immunoblotting of whole cell lysates with anti-CXCR4 and anti-β-actin. B, CXCR4 silencing in THP1 cells and CXCR4 quantification as in Fig. 5B. Red, CXCR4 siRNA. Black, nontargeting siRNA. n = 4. C, FITC-ubiquitin binding curves after CXCR4 silencing, as in A and B. n = 5. FITC-ubiquitin binding (1 min, 4 °C) was measured in nocodazole pretreated cells. RFU, relative fluorescence units. NSB, nonspecific binding. D and E, competition binding curves with AMD3100 (D, n = 4) and SDF-1α (E, n = 4) in THP1 cells; 1.16 μm FITC-ubiquitin. The dashed line in E shows the competition curve for native ubiquitin (from Fig. 2E). FITC-ubiquitin binding is expressed as a percentage of the fluorescence signal measured in the absence of the CXCR4 ligands (100%).
FIGURE 7.
FIGURE 7.
Ubiquitin is a CXCR4 agonist. A, ubiquitin (30 μm)-induced Ca2+ flux after CXCR4 silencing in THP1 cells, as in Fig. 6 (A and B). n = 4. B, cAMP levels in THP1 cells 0–60 min after ubiquitin (1.16 μm) treatment. n = 4. The data are expressed as percentages of untreated cells (100%). C, dose-dependent reduction of cAMP levels in THP1 cells by ubiquitin (○) and SDF-1α (●). n = 4–8. The data are expressed as percentages of untreated cells (100%). D, effects of ubiquitin on cAMP levels after CXCR4 silencing in THP1 cells, as in Fig. 6 (A and B). n = 4. Light gray bars, cells transfected with nontargeting siRNA (n = 2) or siRNA-GAPDH (n = 2). Dark gray bars, cells transfected with siRNA-CXCR4 (n = 4). The data are expressed as percentages of untreated cells (100%). E, AMD3100 (10 μm) inhibits ubiquitin (30 μm)-induced Ca2+ flux in THP1 cells. n = 3. F, AMD3100 (10 μm) abolishes ubiquitin (100 nm)- and SDF-1α (100 nm)-induced reduction of cAMP levels in THP1 cells (n = 4). The data are expressed as percentages of untreated cells (100%). G, FITC-ubiquitin uptake into THP1 cells is reduced by preincubation of cells with CXCR4 ligands. The cells were incubated (30 min, 37 °C) with 100 nm FITC-ubiquitin and used for confocal fluorescence microscopy, as in Fig. 1A. The cells were not pretreated or pretreated (30 min, 37 °C) with 10 μm AMD3100, 1 μm SDF-1α, or 1 μm native ubiquitin (from left to right). Green, FITC-ubiquitin. Blue, DAPI nuclear counterstaining.

Similar articles

Cited by

References

    1. Hershko A., Ciechanover A. (1998) Annu. Rev. Biochem. 67, 425–479 - PubMed
    1. Goldstein G., Scheid M., Hammerling U., Schlesinger D. H., Niall H. D., Boyse E. A. (1975) Proc. Natl. Acad. Sci. U.S.A. 72, 11–15 - PMC - PubMed
    1. Asseman C., Pancré V., Delanoye A., Capron A., Auriault C. (1994) J. Immunol. Methods 173, 93–101 - PubMed
    1. Takada K., Nasu H., Hibi N., Tsukada Y., Shibasaki T., Fujise K., Fujimuro M., Sawada H., Yokosawa H., Ohkawa K. (1997) Clin. Chem. 43, 1188–1195 - PubMed
    1. Takagi M., Yamauchi M., Toda G., Takada K., Hirakawa T., Ohkawa K. (1999) Alcohol. Clin. Exp. Res. 23, (Suppl. 4) 76S–80S - PubMed

Publication types