Genome-wide synteny through highly sensitive sequence alignment: Satsuma
- PMID: 20208069
- PMCID: PMC2859124
- DOI: 10.1093/bioinformatics/btq102
Genome-wide synteny through highly sensitive sequence alignment: Satsuma
Abstract
Motivation: Comparative genomics heavily relies on alignments of large and often complex DNA sequences. From an engineering perspective, the problem here is to provide maximum sensitivity (to find all there is to find), specificity (to only find real homology) and speed (to accommodate the billions of base pairs of vertebrate genomes).
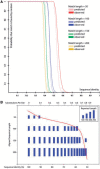
Results: Satsuma addresses all three issues through novel strategies: (i) cross-correlation, implemented via fast Fourier transform; (ii) a match scoring scheme that eliminates almost all false hits; and (iii) an asynchronous 'battleship'-like search that allows for aligning two entire fish genomes (470 and 217 Mb) in 120 CPU hours using 15 processors on a single machine.
Availability: Satsuma is part of the Spines software package, implemented in C++ on Linux. The latest version of Spines can be freely downloaded under the LGPL license from http://www.broadinstitute.org/science/programs/genome-biology/spines/.
Figures


Similar articles
-
transAlign: using amino acids to facilitate the multiple alignment of protein-coding DNA sequences.BMC Bioinformatics. 2005 Jun 22;6:156. doi: 10.1186/1471-2105-6-156. BMC Bioinformatics. 2005. PMID: 15969769 Free PMC article.
-
halSynteny: a fast, easy-to-use conserved synteny block construction method for multiple whole-genome alignments.Gigascience. 2020 Jun 1;9(6):giaa047. doi: 10.1093/gigascience/giaa047. Gigascience. 2020. PMID: 32463100 Free PMC article.
-
Accurate anchoring alignment of divergent sequences.Bioinformatics. 2006 Jan 1;22(1):29-34. doi: 10.1093/bioinformatics/bti772. Epub 2005 Nov 13. Bioinformatics. 2006. PMID: 16301203
-
How to usefully compare homologous plant genes and chromosomes as DNA sequences.Plant J. 2008 Feb;53(4):661-73. doi: 10.1111/j.1365-313X.2007.03326.x. Plant J. 2008. PMID: 18269575 Review.
-
[Development of a large-scale comparative genome system and its application to the analysis of mycobacteria genomes].Nihon Hansenbyo Gakkai Zasshi. 2007 Sep;76(3):251-6. doi: 10.5025/hansen.76.251. Nihon Hansenbyo Gakkai Zasshi. 2007. PMID: 17877037 Review. Japanese.
Cited by
-
Chromosome-Level Reference Genome Assembly for the American Pika (Ochotona princeps).J Hered. 2021 Nov 1;112(6):549-557. doi: 10.1093/jhered/esab031. J Hered. 2021. PMID: 34036348 Free PMC article.
-
Whole genome resequencing and comparative genome analysis of three Puccinia striiformis f. sp. tritici pathotypes prevalent in India.PLoS One. 2022 Nov 3;17(11):e0261697. doi: 10.1371/journal.pone.0261697. eCollection 2022. PLoS One. 2022. PMID: 36327308 Free PMC article.
-
fagin: synteny-based phylostratigraphy and finer classification of young genes.BMC Bioinformatics. 2019 Aug 27;20(1):440. doi: 10.1186/s12859-019-3023-y. BMC Bioinformatics. 2019. PMID: 31455236 Free PMC article.
-
Rapid morphological divergence following a human-mediated introduction: the role of drift and directional selection.Heredity (Edinb). 2020 Apr;124(4):535-549. doi: 10.1038/s41437-020-0298-8. Epub 2020 Feb 20. Heredity (Edinb). 2020. PMID: 32080374 Free PMC article.
-
A universal genomic coordinate translator for comparative genomics.BMC Bioinformatics. 2014 Jun 30;15:227. doi: 10.1186/1471-2105-15-227. BMC Bioinformatics. 2014. PMID: 24976580 Free PMC article.
References
-
- Altschul SF, et al. Basic local alignment search tool. J. Mol. Biol. 1990;215:403–410. - PubMed
-
- Bellman R. Dynamic Programming. Princeton, NJ: Dover paperback edition 2003. Princeton University Press; 1957.
-
- Brodzik AK. A comparative study of cross-correlation methods for alignment of DNA sequences containing repetitive patterns. 13th European Signal Processing Conference EU-SIPCO 2005. 2005 Available at http://www.eurasip.org/Proceedings/Eusipco/Eusipco2005/defevent/papers/c....
-
- Chiaromonte F, et al. Scoring pairwise genomic sequence alignments. Pac. Symp. Biocomput. 2002;115:26. - PubMed
-
- Cooley JW, Tukey JW. An algorithm for the machine calculation of complex Fourier series. Math. Comput. 1965;19:297–301.
Publication types
MeSH terms
Grants and funding
LinkOut - more resources
Full Text Sources
Miscellaneous

