Lysosomal degradation of alpha-synuclein in vivo
- PMID: 20200163
- PMCID: PMC2859524
- DOI: 10.1074/jbc.M109.074617
Lysosomal degradation of alpha-synuclein in vivo
Abstract
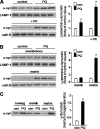
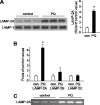
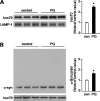
Pathologic accumulation of alpha-synuclein is a feature of human parkinsonism and other neurodegenerative diseases. This accumulation may be counteracted by mechanisms of protein degradation that have been investigated in vitro but remain to be elucidated in animal models. In this study, lysosomal clearance of alpha-synuclein in vivo was indicated by the detection of alpha-synuclein in the lumen of lysosomes isolated from the mouse midbrain. When neuronal alpha-synuclein expression was enhanced as a result of toxic injury (i.e. treatment of mice with the herbicide paraquat) or transgenic protein overexpression, the intralysosomal content of alpha-synuclein was also significantly increased. This effect was paralleled by a marked elevation of the lysosome-associated membrane protein type 2A (LAMP-2A) and the lysosomal heat shock cognate protein of 70 kDa (hsc70), two essential components of chaperone-mediated autophagy (CMA). Immunofluorescence microscopy revealed an increase in punctate (lysosomal) LAMP-2A staining that co-localized with alpha-synuclein within nigral dopaminergic neurons of paraquat-treated and alpha-synuclein-overexpressing animals. The data provide in vivo evidence of lysosomal degradation of alpha-synuclein under normal conditions and, quite importantly, under conditions of enhanced protein burden. In the latter, increased lysosomal clearance of alpha-synuclein was mediated, at least in part, by CMA induction. It is conceivable that these neuronal mechanisms of protein clearance play an important role in neurodegenerative processes characterized by abnormal alpha-synuclein buildup.
Figures


Similar articles
-
Age-dependent accumulation of oligomeric SNCA/α-synuclein from impaired degradation in mutant LRRK2 knockin mouse model of Parkinson disease: role for therapeutic activation of chaperone-mediated autophagy (CMA).Autophagy. 2020 Feb;16(2):347-370. doi: 10.1080/15548627.2019.1603545. Epub 2019 Apr 14. Autophagy. 2020. PMID: 30983487 Free PMC article.
-
The lysosomal membrane protein LAMP2A promotes autophagic flux and prevents SNCA-induced Parkinson disease-like symptoms in the Drosophila brain.Autophagy. 2018;14(11):1898-1910. doi: 10.1080/15548627.2018.1491489. Epub 2018 Aug 10. Autophagy. 2018. PMID: 29989488 Free PMC article.
-
The role of chaperone-mediated autophagy in neurotoxicity induced by alpha-synuclein after methamphetamine exposure.Brain Behav. 2019 Aug;9(8):e01352. doi: 10.1002/brb3.1352. Epub 2019 Jul 9. Brain Behav. 2019. PMID: 31286692 Free PMC article.
-
Autophagy and Alpha-Synuclein: Relevance to Parkinson's Disease and Related Synucleopathies.Mov Disord. 2016 Feb;31(2):178-92. doi: 10.1002/mds.26477. Epub 2016 Jan 27. Mov Disord. 2016. PMID: 26813776 Review.
-
Chaperone-mediated autophagy.Autophagy. 2007 Jul-Aug;3(4):295-9. doi: 10.4161/auto.4144. Epub 2007 Jul 15. Autophagy. 2007. PMID: 17404494 Review.
Cited by
-
The relationship of alpha-synuclein to mitochondrial dynamics and quality control.Front Mol Neurosci. 2022 Aug 26;15:947191. doi: 10.3389/fnmol.2022.947191. eCollection 2022. Front Mol Neurosci. 2022. PMID: 36090250 Free PMC article. Review.
-
The Interplay between Alpha-Synuclein Clearance and Spreading.Biomolecules. 2015 Apr 14;5(2):435-71. doi: 10.3390/biom5020435. Biomolecules. 2015. PMID: 25874605 Free PMC article. Review.
-
Examining the mechanisms that link β-amyloid and α-synuclein pathologies.Alzheimers Res Ther. 2012 Apr 30;4(2):11. doi: 10.1186/alzrt109. eCollection 2012. Alzheimers Res Ther. 2012. PMID: 22546279 Free PMC article. Review.
-
The Role of Chaperone-Mediated Autophagy in Cell Cycle Control and Its Implications in Cancer.Cells. 2020 Sep 22;9(9):2140. doi: 10.3390/cells9092140. Cells. 2020. PMID: 32971884 Free PMC article. Review.
-
Synaptic dysfunction in genetic models of Parkinson's disease: a role for autophagy?Neurobiol Dis. 2011 Jul;43(1):60-7. doi: 10.1016/j.nbd.2010.10.011. Epub 2010 Oct 20. Neurobiol Dis. 2011. PMID: 20969957 Free PMC article. Review.
References
-
- Singleton A. B., Farrer M., Johnson J., Singleton A., Hague S., Kachergus J., Hulihan M., Peuralinna T., Dutra A., Nussbaum R., Lincoln S., Crawley A., Hanson M., Maraganore D., Adler C., Cookson M. R., Muenter M., Baptista M., Miller D., Blancato J., Hardy J., Gwinn-Hardy K. (2003) Science 302, 841. - PubMed
-
- Farrer M., Kachergus J., Forno L., Lincoln S., Wang D. S., Hulihan M., Maraganore D., Gwinn-Hardy K., Wszolek Z., Dickson D., Langston J. W. (2004) Ann. Neurol. 55, 174–179 - PubMed
-
- Eslamboli A., Romero-Ramos M., Burger C., Bjorklund T., Muzyczka N., Mandel R. J., Baker H., Ridley R. M., Kirik D. (2007) Brain 130, 799–815 - PubMed
-
- Webb J. L., Ravikumar B., Atkins J., Skepper J. N., Rubinsztein D. C. (2003) J. Biol. Chem. 278, 25009–25013 - PubMed
Publication types
MeSH terms
Substances
Grants and funding
LinkOut - more resources
Full Text Sources
Medical
Molecular Biology Databases
Miscellaneous

