

An antagonism between the AKT and beta-adrenergic signaling pathways mediated through their reciprocal effects on miR-199a-5p
- PMID: 20193759
- PMCID: PMC2872486
- DOI: 10.1016/j.cellsig.2010.02.008
An antagonism between the AKT and beta-adrenergic signaling pathways mediated through their reciprocal effects on miR-199a-5p
Abstract
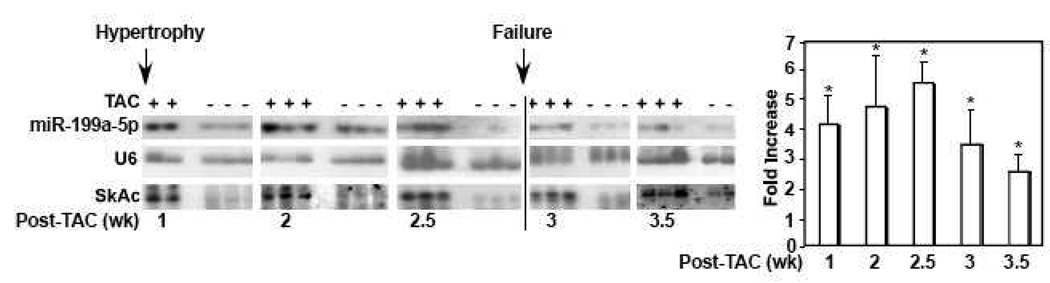
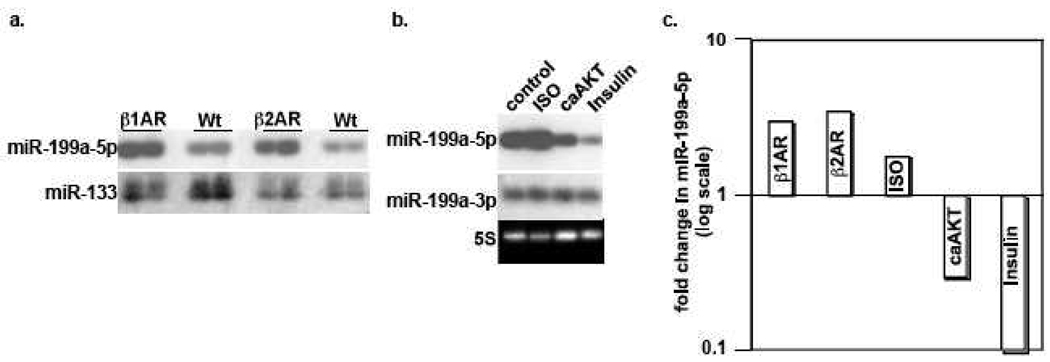
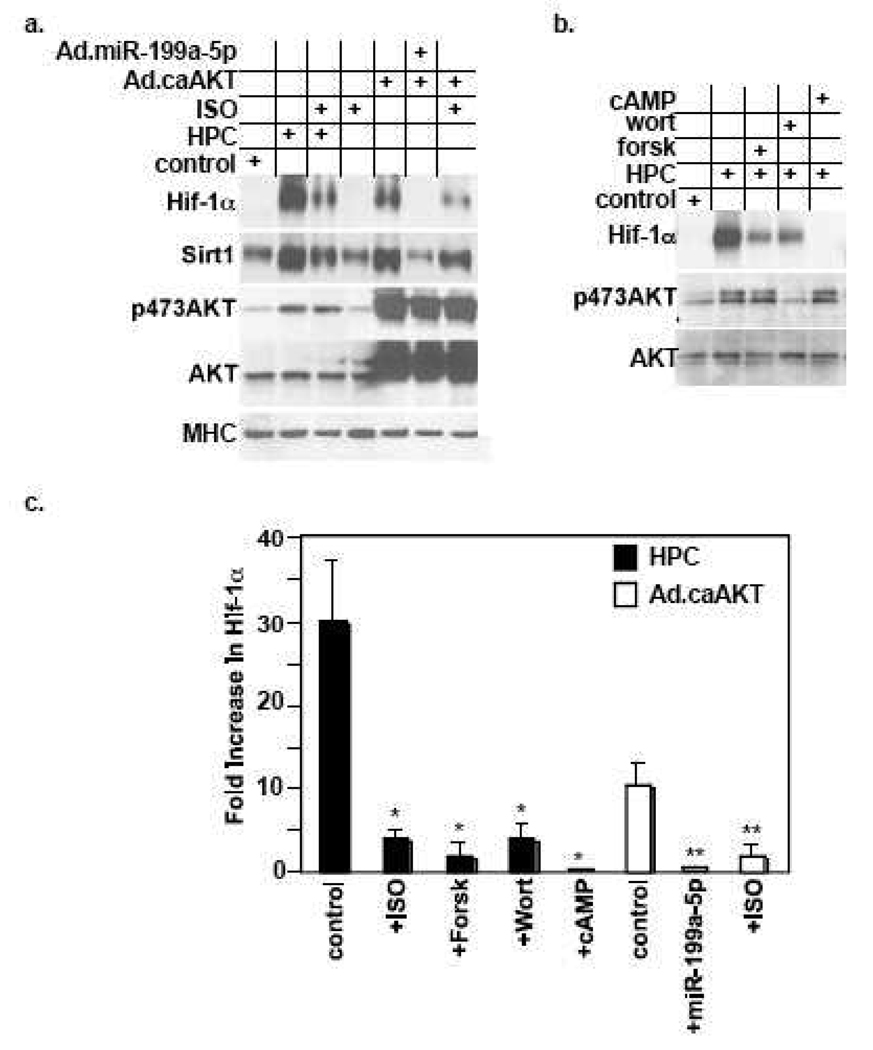
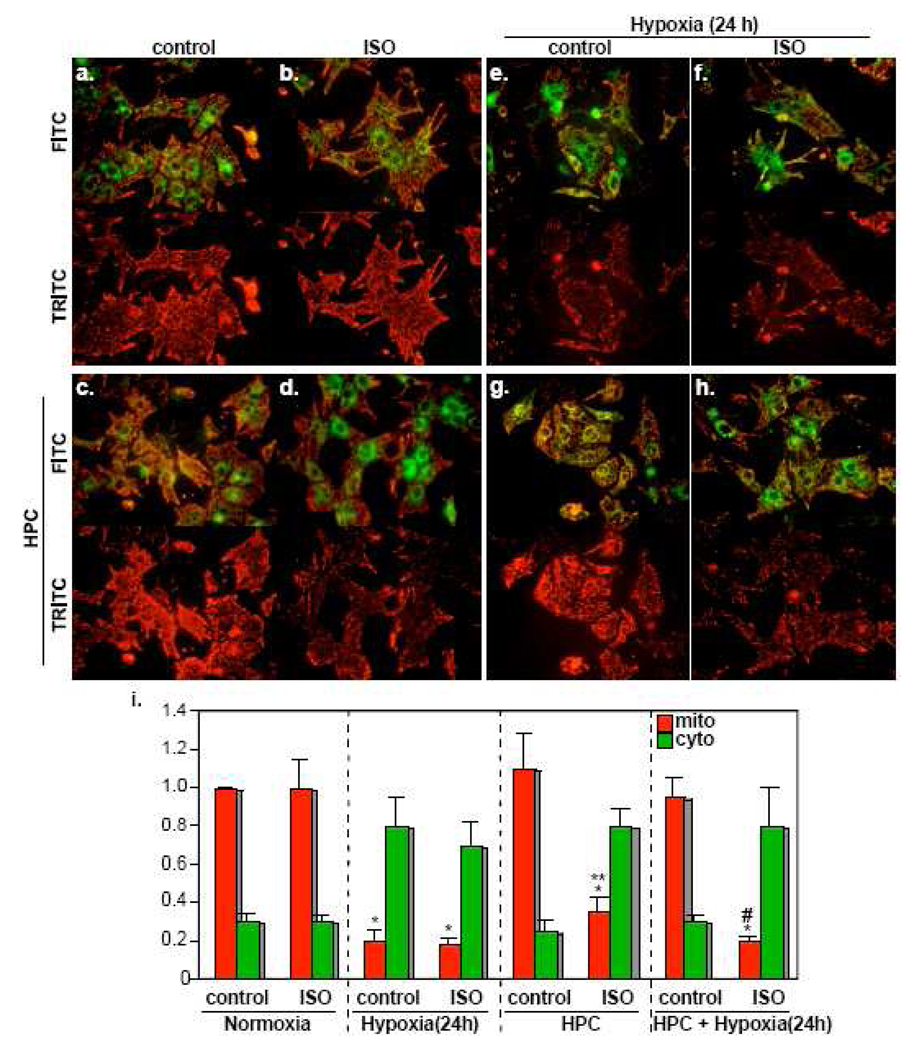
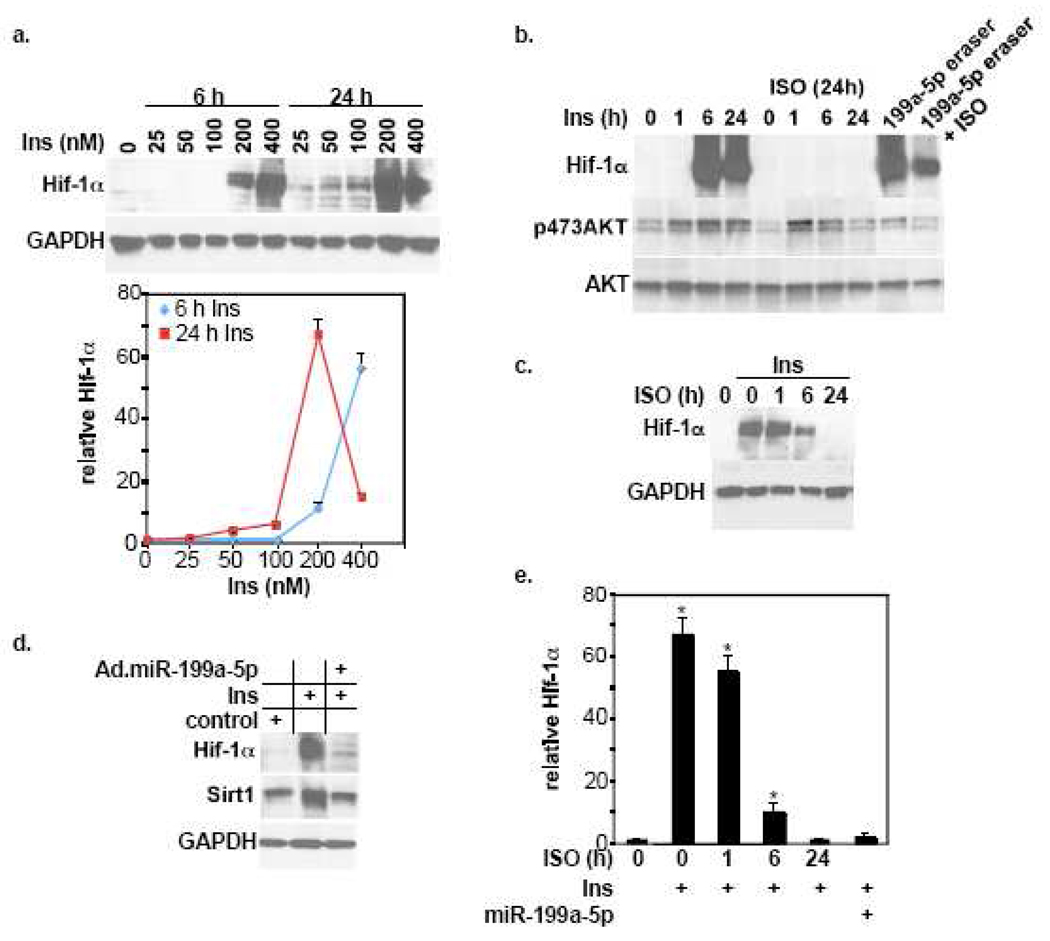
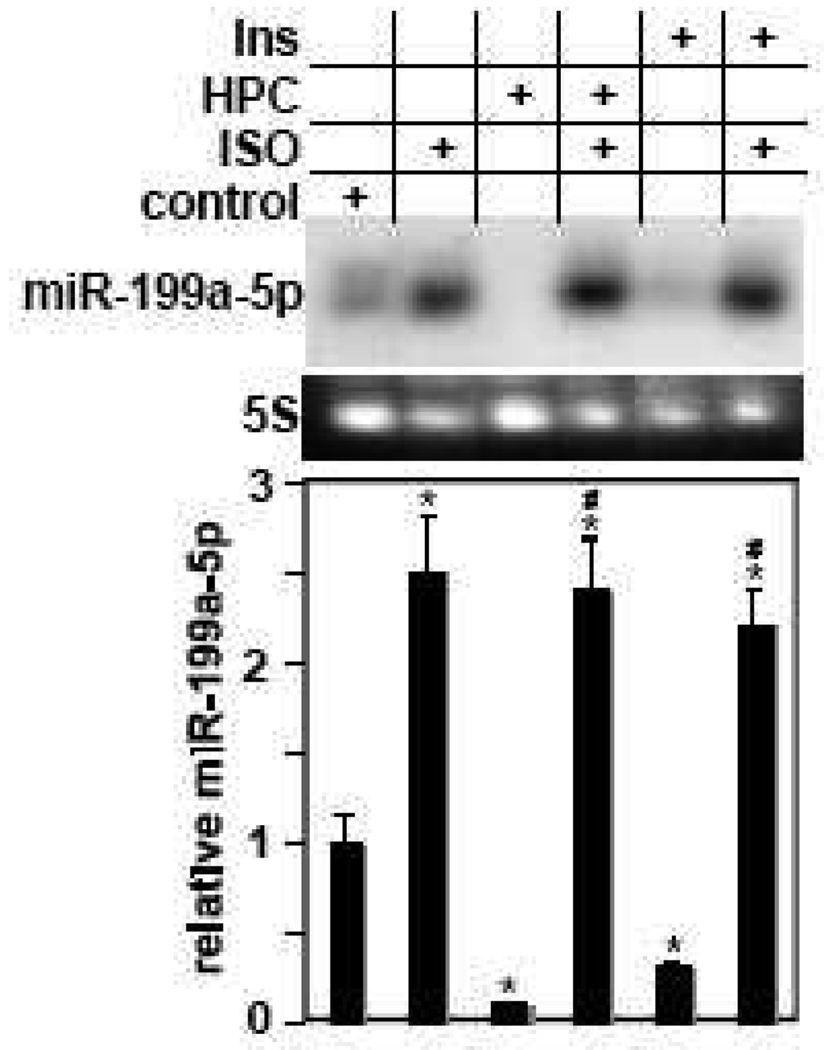
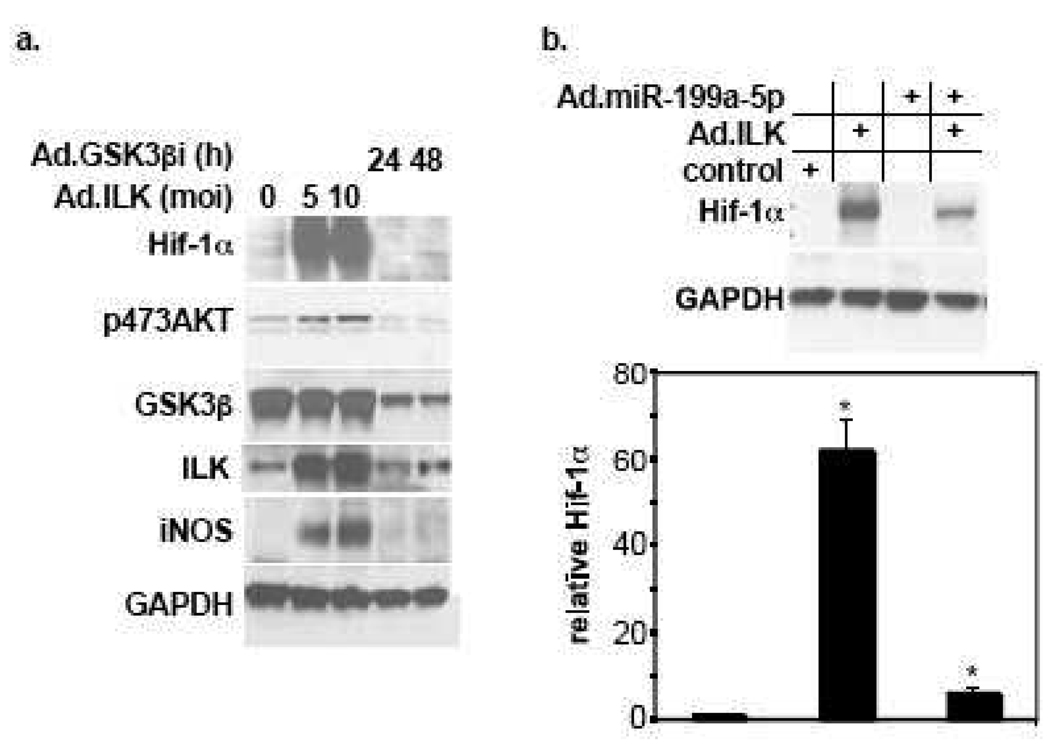
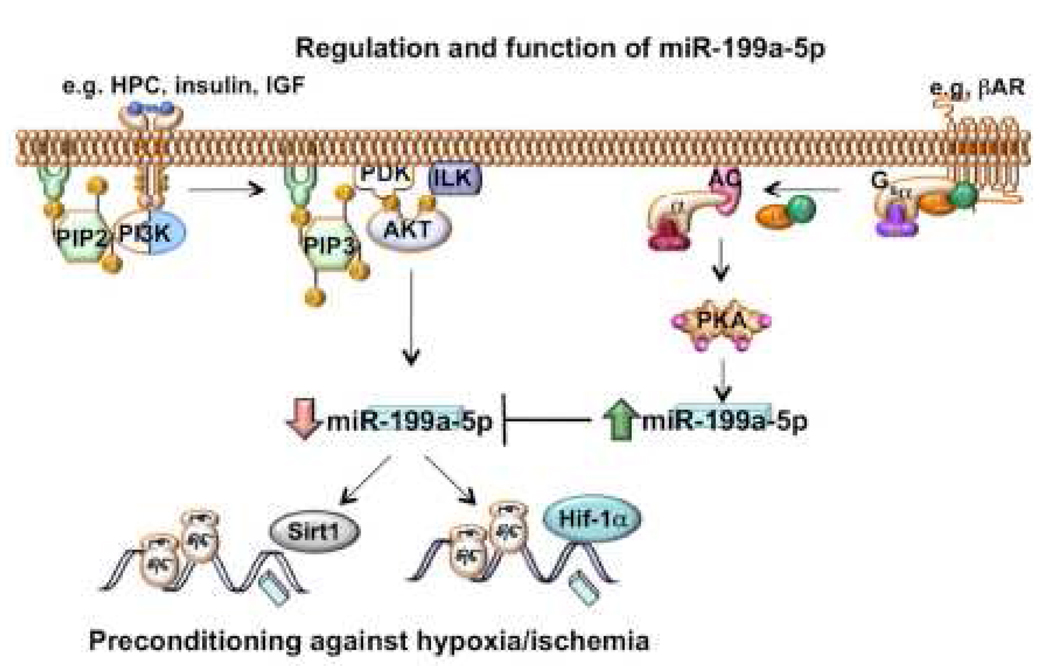
We have recently reported that downregulation of miR-199a-5p is necessary and sufficient for inducing upregulation of its targets, including hypoxia-inducible factor-1 alpha (Hif-1 alpha) and Sirt1, during hypoxia preconditioning (HPC). Conversely, others and we have reported that miR-199a-5p is upregulated during cardiac hypertrophy. Thus, the objective of this study was to delineate the signaling pathways that regulate the expression of miR-199a-5p and its targets, and their role in myocyte survival during hypoxia. Since HPC is mediated through activation of the AKT pathway, we questioned if AKT is sufficient for inducing downregulation of miR-199a-5p. Our present study shows that overexpression of a constitutively active AKT (caAKT) induced 70% reduction in miR-199a-5p and was associated with a robust increase in HiF-1 alpha (10+/-2 fold) and Sirt1 (4+/-0.8 fold) that was reversed by overexpression of miR-199a-5p. Similarly, insulin receptor-stimulated activation of the AKT pathway induced downregulation of miR-199a-5p and upregulation of its targets. In contrast, beta-adrenergic receptor (beta AR) activation in vitro and in vivo, induced 1.8-3.5-fold increase in miR-199a-5p. Accordingly, we predicted that beta AR would antagonize AKT-induced, miR-199a-5p-dependent, upregulation of Hif-1 alpha and Sirt1. Indeed, pre-treating the myocytes with isoproterenol before applying HPC, caAKT, or insulin resulted in 87+/-3%, 75+/-15%, and 100% reductions in Hif-1 alpha expression, respectively, and sensitized the cells to hypoxic injury. Thus, activation of beta-adrenergic signaling counteracts the survival effects of the AKT pathway via upregulating miR-199a-5p.
(c) 2010 Elsevier Inc. All rights reserved.
Figures
Similar articles
-
Downregulation of miR-199a derepresses hypoxia-inducible factor-1alpha and Sirtuin 1 and recapitulates hypoxia preconditioning in cardiac myocytes.Circ Res. 2009 Apr 10;104(7):879-86. doi: 10.1161/CIRCRESAHA.108.193102. Epub 2009 Mar 5. Circ Res. 2009. PMID: 19265035 Free PMC article.
-
Qiliqiangxin Attenuates Phenylephrine-Induced Cardiac Hypertrophy through Downregulation of MiR-199a-5p.Cell Physiol Biochem. 2016;38(5):1743-51. doi: 10.1159/000443113. Epub 2016 May 9. Cell Physiol Biochem. 2016. PMID: 27161004
-
MicroRNA-17-5p Promotes Cardiac Hypertrophy by Targeting Mfn2 to Inhibit Autophagy.Cardiovasc Toxicol. 2021 Sep;21(9):759-771. doi: 10.1007/s12012-021-09667-w. Epub 2021 Jun 12. Cardiovasc Toxicol. 2021. PMID: 34120306
-
MiR-199a-5p promotes ferroptosis-induced cardiomyocyte death responding to oxygen-glucose deprivation/reperfusion injury via inhibiting Akt/eNOS signaling pathway.Kaohsiung J Med Sci. 2022 Nov;38(11):1093-1102. doi: 10.1002/kjm2.12605. Epub 2022 Oct 18. Kaohsiung J Med Sci. 2022. PMID: 36254861
-
Akt mediates the cross-talk between beta-adrenergic and insulin receptors in neonatal cardiomyocytes.Circ Res. 2005 Feb 4;96(2):180-8. doi: 10.1161/01.RES.0000152968.71868.c3. Epub 2004 Dec 9. Circ Res. 2005. PMID: 15591229
Cited by
-
Vitamin D and microRNAs in bone.Crit Rev Eukaryot Gene Expr. 2013;23(3):195-214. doi: 10.1615/critreveukaryotgeneexpr.2013007147. Crit Rev Eukaryot Gene Expr. 2013. PMID: 23879537 Free PMC article. Review.
-
MicroRNAs in diabetic macroangiopathy.Cardiovasc Diabetol. 2024 Sep 16;23(1):344. doi: 10.1186/s12933-024-02405-w. Cardiovasc Diabetol. 2024. PMID: 39285459 Free PMC article. Review.
-
Flexible and versatile as a chameleon-sophisticated functions of microRNA-199a.Int J Mol Sci. 2012;13(7):8449-8466. doi: 10.3390/ijms13078449. Epub 2012 Jul 9. Int J Mol Sci. 2012. PMID: 22942713 Free PMC article. Review.
-
First-Trimester Screening for Fetal Growth Restriction and Small-for-Gestational-Age Pregnancies without Preeclampsia Using Cardiovascular Disease-Associated MicroRNA Biomarkers.Biomedicines. 2022 Mar 19;10(3):718. doi: 10.3390/biomedicines10030718. Biomedicines. 2022. PMID: 35327520 Free PMC article.
-
Differentially Expressed miRNAs in Ulcerative Colitis and Crohn's Disease.Front Immunol. 2022 Jun 6;13:865777. doi: 10.3389/fimmu.2022.865777. eCollection 2022. Front Immunol. 2022. PMID: 35734163 Free PMC article. Review.
References
Publication types
MeSH terms
Substances
Grants and funding
LinkOut - more resources
Full Text Sources
Other Literature Sources
Molecular Biology Databases
Research Materials
