. 2010 Feb 22;188(4):473-9.
doi: 10.1083/jcb.200912024.

Metabolic control of G1-S transition: cyclin E degradation by p53-induced activation of the ubiquitin-proteasome system

Affiliations

Metabolic control of G1-S transition: cyclin E degradation by p53-induced activation of the ubiquitin-proteasome system

Sudip Mandal et al. J Cell Biol. .

Abstract

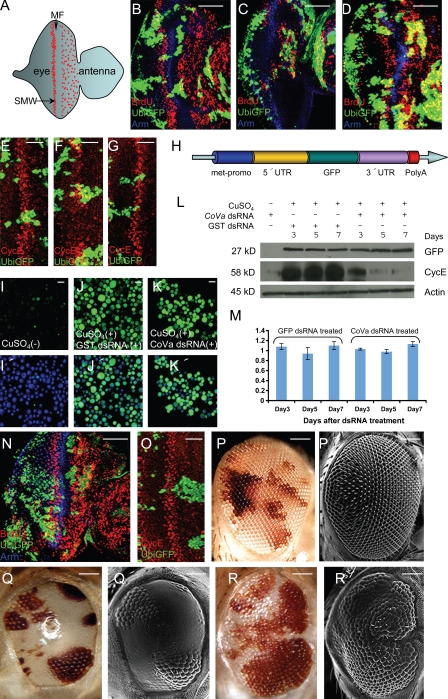
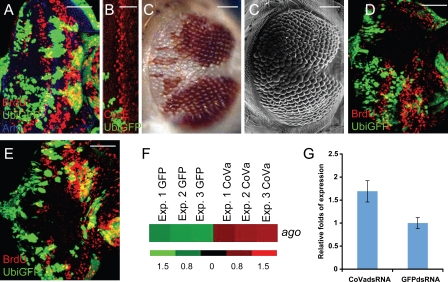
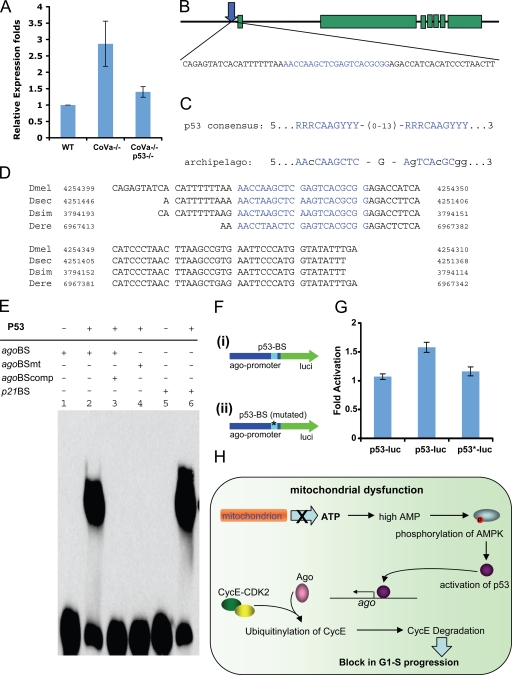
Cell cycle progression is precisely regulated by diverse extrinsic and intrinsic cellular factors. Previous genetic analysis in Drosophila melanogaster has shown that disruption of the mitochondrial electron transport chain activates a G1-S checkpoint as a result of a control of cyclin E by p53. This regulation does not involve activation of the p27 homologue dacapo in flies. We demonstrate that regulation of cyclin E is not at the level of transcription or translation. Rather, attenuated mitochondrial activity leads to transcriptional upregulation of the F-box protein archipelago, the Fbxw7 homologue in flies. We establish that archipelago and the proteasomal machinery contribute to degradation of cyclin E in response to mitochondrial dysfunction. Our work provides in vivo genetic evidence for p53-mediated integration of metabolic stress signals, which modulate the activity of the ubiquitin-proteasome system to degrade cyclin E protein and thereby impose cell cycle arrest.


Figures

Figure 1.
Figure 1.
Regulation of cyclin E in CoVa mutant cells. (A) Schematic diagram of a developing third instar larval eye disc of Drosophila. Anterior is to the right. Scattered red dots anterior to the MF represent random BrdU incorporation, whereas the band of red dots marks the synchronous incorporation of BrdU along the SMW. (B–D) The defect in BrdU incorporation in CoVa mutants can be rescued by p53 mutation. BrdU incorporation (red) in third instar larval eye disc. Armadillo (blue) marks the MF, and the clones are marked by the lack of GFP. Bars, 50 µm. (B) The normal pattern of BrdU incorporation in a control eye disc in which both green and nongreen cells are wild type. (C) An eye disc with somatic clones of CoVa/CoVa cells (nongreen) fails to incorporate BrdU both anterior and posterior to the MF. (D) Somatic clones of CoVa/CoVa, p53/p53 cells (nongreen) are rescued for BrdU incorporation (compare with C). (E–G) p53 mutation restores cyclin E expression (red) along the SMW in CoVa mutant clones. Clones are marked by the absence of GFP. Bars, 25 µm. (E) Expression of cyclin E as a band posterior to the furrow in a control eye disc where both the green and the nongreen cells are wild type. (F) Cyclin E expression is significantly reduced in CoVa mutant clones (nongreen). (G) In double-mutant clones of CoVa and p53 (nongreen), cyclin E expression recovers to wild-type levels. (H) A reporter construct used to investigate possible roles of cyclin E 5′ and 3′ UTRs in translational regulation. This construct consists of a GFP-expressing fragment cloned between the 5′ and 3′ UTRs of cyclin E. The expression of GFP transcripts is under the control of a metallothionein-inducible promoter. (I–K′) CuSO4-inducible GFP expression is not affected in S2 cells harboring the 5′-3′ cyclin E UTR-GFP reporter upon CoVa dsRNA treatment. In I–K, the GFP expression is shown in green, and the overlap of GFP expression with the cell nuclei marked by TO-PRO 3 (blue) is shown in I′–K′. Bars, 20 µm. (I and I′) Very low levels of basal GFP expression in cells that are not induced by CuSO4. (J and J′) Reporter GFP expression in control cells that are transfected with GST dsRNA. (K and K′) Compared with control, no change in reporter GFP expression is seen in cells transfected with CoVa dsRNA. (L) Western blot analysis performed 3, 5, and 7 d after treatment of S2 cells with GST dsRNA or CoVa dsRNA by using the indicated antibodies. Levels of GFP reporter expression are comparable in both GST and CoVa dsRNA–treated cells, but cyclin E expression is dramatically reduced in CoVa dsRNA–transfected cells. Actin was used as a loading control, and the lanes are as indicated. (M) Real-time RT-PCR analysis of cyclin E transcripts in S2 cells on 3, 5, or 7 d after treatment with either GST or CoVa dsRNA. Unlike the loss of cyclin E protein seen in L, cyclin E RNA levels remain unchanged. The data were normalized with respect to the expression of rp49 transcripts. (N) BrdU incorporation (red) in eye disc with clones of l(3)73Ai/ l(3)73Ai+, CoVa/CoVa cells (nongreen). A remarkable recovery of BrdU incorporation is seen in these clones (compare with C). l(3)73Ai encodes the β6 subunit of 20S proteasome core. Bar, 50 µm. (O) Expression of cyclin E (red) is also restored to wild-type levels in clones with l(3)73Ai/ l(3)73Ai+, CoVa/CoVa cells (nongreen; compare with F). Bar, 25 µm. (P–R′) Reduced dosage of l(3)73Ai partially rescues the glossy adult eye phenotype of CoVa mutant clones. Bright-field images (P–R) and the corresponding scanning electron micrographs (P′–R′) of the same adult eye with somatic clones (marked by the absence of red pigmentation). (P and P′) Normal facets in control adult eye in which both red and white tissue are wild type. (Q and Q′) Adult eye with clones of CoVa/CoVa cells. Facets are identifiable in the wild-type tissue (red), whereas the mutant tissue (white) appears glossy. (R and R′) The glossy eye phenotype of CoVa clones is partially rescued in clones of l(3)73Ai/ l(3)73Ai+, CoVa/CoVa cells. Bars, 100 µm. Error bars indicate SEM.
Figure 2.
Figure 2.
Loss of ago rescues the CoVa mutant phenotype. (A) Defects in BrdU incorporation (red) is significantly recovered in eye disc with clones of ago+/ago, CoVa/CoVa cells (nongreen; compare with Fig. 1 C). Armadillo (blue) marks the MF. Bar, 50 µm. (B) Loss of ago restores wild-type expression of cyclin E (red) along the SMW in eye discs with clones of ago+/ago, CoVa/CoVa cells (nongreen; compare with Fig. 1 F). Bar, 25 µm. (C and C′) Bright-field image (C) and the corresponding SEM (C′) of an adult eye with clones of ago+/ago, CoVa/CoVa cells. Mutant clones are marked by the absence of red pigmentation. Loss of ago partially rescues the glossy adult eye phenotype associated with CoVa mutant clones (compare with Fig. 1, R and R′). Bars, 100 µm. (D and E) Reducing the dosage of Cullin 1 (D) or Cullin 3 (E) in CoVa mutant cells (nongreen) fails to rescue the defects in BrdU incorporation (red). Bars, 50 µm. (F) Expression profile of ago in S2 cells treated with CoVa dsRNA or GFP dsRNA controls. Gene expression profiling was performed in three independent replicates (Exp.1–3) using Drosophila genome 2 microarrays. The guide at the bottom of the figure indicates the fold difference of expression between the samples, with green indicating lower expression and red indicating higher expression. (G) Real-time RT-PCR analysis of ago transcripts in S2 cells treated either with CoVa dsRNA or GFP dsRNA (control) that were used for performing the microarray analysis. An up-regulation in ago expression is observed in cells knocked down for CoVa transcripts compared with the control. Error bars indicate SEM.
Figure 3.
Figure 3.
ago is a direct downstream target of p53. (A) Real-time RT-PCR analysis of ago transcripts in third instar larval eye discs having somatic clones of wild-type cells, CoVa mutant cells (CoVa−/−), or that of CoVa and p53 double-mutant cells (CoVa−/−, p53−/−). The up-regulation in ago transcripts as seen in eye discs with CoVa mutant cells is restored to almost wild-type level in eye discs with double-mutant clones of CoVa and p53. (B) Genomic structure of ago highlighting the p53 response element in the 5′ regulatory region of ago-RB and ago-RC transcripts that share the same promoter region. Blue text denotes the putative p53-binding sequence and the mRNA, ago-RC, is shown in the figure. (C) Alignment of the consensus p53-binding sequence with the p53 response element found in the 5′ regulatory region of ago. The invariant core nucleotides of each 10-mer motif matches at seven of eight positions, whereas the other mismatches (shown in lower case) occur at the outer positions of the 20-bp element. (D) Conserved sequence in the 5′ regulatory region of ago across the members of the melanogaster subfamily of Drosophila with the p53 response element highlighted in blue. (E) EMSA demonstrating the binding of purified p53 to its putative binding sequence in ago. (lanes 1 and 2) A shift in the migration of the biotinylated p53 response element of ago is seen in the presence of p53 protein. (lane 3) This binding is competed by unlabeled oligonucleotide. (lane 4) Mutating the core nucleotide sequence of the two 10 mers within the p53 response element prevents binding of p53. (lanes 5 and 6) As a control, a shift in the migration of a biotinylated oligonucleotide representing the p53 response element of mammalian p21 is seen in the presence of p53 protein. (F) The reporter constructs used to investigate p53-dependent activation of ago promoter in CoVa mutant cells. Construct i consisted of the 200-bp of the ago promoter with normal p53-binding site cloned upstream of the firefly luciferase reporter gene. Construct ii is similar to construct i except for the p53-binding site being mutated. (G) Relative folds of activation of the reporter firefly luciferase in GFP dsRNA or CoVa dsRNA–treated cells. The datasets were normalized to the expression of Renilla luciferase, and mean values with standard deviation of three independent experiments are displayed. Compared with GFP dsRNA–transfected cells, CoVa dsRNA–transfected cells show almost 1.7-fold increase in the expression levels of firefly luciferase. However, this increase is not seen when the p53 site in ago promoter is mutated. Asterisks indicate a mutation in the P53-binding site (p53BS). (H) A model for the p53-mediated pathway linking attenuated mitochondrial function in CoVa mutants to G1–S block caused as a result of degradation of cyclin (E). Error bars indicate SEM.

Similar articles

Cited by

References

    1. Baker N.E. 2001. Cell proliferation, survival, and death in the Drosophila eye. Semin. Cell Dev. Biol. 12:499–507 10.1006/scdb.2001.0274 - DOI - PubMed
    1. Bhaumik S.R., Malik S. 2008. Diverse regulatory mechanisms of eukaryotic transcriptional activation by the proteasome complex. Crit. Rev. Biochem. Mol. Biol. 43:419–433 10.1080/10409230802605914 - DOI - PubMed
    1. Brodsky M.H., Nordstrom W., Tsang G., Kwan E., Rubin G.M., Abrams J.M. 2000. Drosophila p53 binds a damage response element at the reaper locus. Cell. 101:103–113 10.1016/S0092-8674(00)80627-3 - DOI - PubMed
    1. Clemens J.C., Worby C.A., Simonson-Leff N., Muda M., Maehama T., Hemmings B.A., Dixon J.E. 2000. Use of double-stranded RNA interference in Drosophila cell lines to dissect signal transduction pathways. Proc. Natl. Acad. Sci. USA. 97:6499–6503 10.1073/pnas.110149597 - DOI - PMC - PubMed
    1. de Moor C.H., Meijer H., Lissenden S. 2005. Mechanisms of translational control by the 3′ UTR in development and differentiation. Semin. Cell Dev. Biol. 16:49–58 10.1016/j.semcdb.2004.11.007 - DOI - PubMed

Publication types

MeSH terms