. 2010 Jun;38(11):3780-93.
doi: 10.1093/nar/gkq083. Epub 2010 Feb 21.

The microRNA miR-124 controls gene expression in the sensory nervous system of Caenorhabditis elegans

Affiliations

The microRNA miR-124 controls gene expression in the sensory nervous system of Caenorhabditis elegans

Alejandra M Clark et al. Nucleic Acids Res. 2010 Jun.

Abstract

miR-124 is a highly conserved microRNA (miRNA) whose in vivo function is poorly understood. Here, we identify miR-124 targets based on the analysis of the first mir-124 mutant in any organism. We find that miR-124 is expressed in many sensory neurons in Caenorhabditis elegans and onset of expression coincides with neuronal morphogenesis. We analyzed the transcriptome of miR-124 expressing and nonexpressing cells from wild-type and mir-124 mutants. We observe that many targets are co-expressed with and actively repressed by miR-124. These targets are expressed at reduced relative levels in sensory neurons compared to the rest of the animal. Our data from mir-124 mutant animals show that this effect is due to a large extent to the activity of miR-124. Genes with nonconserved target sites show reduced absolute expression levels in sensory neurons. In contrast, absolute expression levels of genes with conserved sites are comparable to control genes, suggesting a tuning function for many of these targets. We conclude that miR-124 contributes to defining cell-type-specific gene activity by repressing a diverse set of co-expressed genes.


Figures
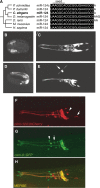
Figure 1.
Figure 1.
Caenorhabditis elegans miR-124 is expressed in ciliated sensory neurons (A) miR-124 primary sequence is highly conserved from C. elegans to Homo sapiens. Topology of phylogenetic tree is based on ref. (86). (B–E) mir-124 promoter::gfp is expressed in C. elegans sensory neurons at different developmental stages. (B and D) Embryos at mid- (350 min post-fertilization) and late- (∼600 min post-fertilization) embryogenesis, respectively, (C and E) at early larval stages L2, L1, respectively. This expression persists through adulthood. (E) Arrow indicates mir-124 promoter::gfp expression in the phasmid sensory neurons. (B and C) Dorsal and (D and E) lateral views. (B–E) Anterior is left, (E) ventral is down. (F–H) mir-124 is expressed in a subset of ciliated neurons as indicated by its overlap with osm-9::gfp expression pattern. (F) An adult animal expressing mir-124 promoter::mCherry. Arrowhead and arrow indicate I6 (not ciliated) and ADE neurons, respectively, not overlapping with osm-9. (G) osm-9::gfp, arrowhead and arrow indicate IL2s and OLQs not overlapping with mir-124 expression pattern. (H) Merge of mir-124 promoter::mCherry and osm-9::gfp shows colocalization in amphid sensory neurons. This colocalization is evident from embryogenesis (data not shown) and persists through adulthood.
Figure 2.
Figure 2.
Genomic location of mir-124 and mutant allele. (A) mir-124 lies within a ∼6-kb intron of host gene trpa-1. The n4255 allele is a 212-bp deletion that spans the entire mature sequence of miR-124. This deletion does not abrogate trpa-1 expression (see Supplementary Figure S1). (B) Northern blot shows expression of mature miR-124 in wild-type (wt) and absence in n4255 mutant, miR-52 was used as loading control.
Figure 3.
Figure 3.
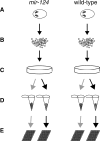
Isolation and expression analysis of miR-124 expressing cells from wild-type and mir-124 mutants. (A) Embryo isolation, (B) cell dissociation by chitinase and trypsin treatment, (C) embryonic cell culture, (D) enrichment of GFP+ and GFP- cell by FACS, (E) analysis of mRNA expression by Affymetrix arrays.
Figure 4.
Figure 4.
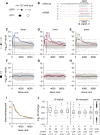
Genes with increased expression in mir-124 mutant (n4255) GFP+ cells are enriched for miR-124 3′UTR seed matches. (A) Schematic representation of sorted cell populations for illustration in subsequent figures. miR-124 expressing cells (GFP+) and other cells of the body (GFP−), are represented by the schematic of a neuron and an oval, respectively. Black indicates mir-124 mutant cells. (B) Relationship between mature miR-124 and 3′UTR nucleotide sequences (words) associated with gene expression changes in mir-124 mutant GFP+ cells. miRNA nucleotides 2–7 (seed), the complementary mRNA sequence (seed match) and positions flanking the seed match opposite miRNA nucleotide 1 and 8 (positions t1 and t8, respectively) are indicated. (C–H) Nucleotide words were identified by the Sylamer method. Genes were ranked from most increased to most reduced expression in mutant compared to wild-type GFP+ cells (C–E) and GFP− cells (F–H). We tested for enrichment and depletion of all possible 6-, 7- and 8-nt words among the 3′UTR sequences of highly ranking genes for a range of cut-off values (cut-offs were chosen to be multiples of 500). Left, middle and right panels show results for 8-, 7- and 6-nt words, respectively. Distinct lines correspond to distinct nucleotide words. At a given cut-off (x-axis) the height of a line indicates enrichment (positive y-axis) or depletion (negative y-axis) among sequences to the left of that cut-off. Dashed black lines indicate significance thresholds corresponding to a Bonferroni corrected P-value of 0.05. Words exceeding this threshold were highlighted. Vertical colored lines indicate the cut-off for which highest statistical significance was achieved, colored numbers indicate the enrichment (number of observed/number of expected occurrences) for the corresponding word among sequences to the left of the line. For the same comparison in GFP− cells, nucleotide words did not show any statistically significant bias in their occurrence (F–H). (I) Enrichment of seed matches comprising a t8 match and a t1 A (yellow) or t1 U (blue) among sequences to the left of a given cut-off. (J) Boxplots summarize log2-fold changes between mutant and wild-type GFP+ cells for genes with a 3′UTR seed match of a given type. Only genes with a single seed match were considered. Genes were grouped according to whether the t8 nucleotide formed a Watson–Crick pair with the corresponding base in the miRNA (t8 match/mismatch) and according to the identity of the t1 nucleotide. Boxes indicate interquartile ranges, horizontal solid lines medians, whiskers extend to the most extreme data points that lie within 1.5 times the interquartile range from the quartiles, outliers are indicated by crosses. P-values are based on a two-sided Wilcoxon rank-sum test, comparing fold changes of genes with a given seed match type to those of genes with no seed match.
Figure 5.
Figure 5.
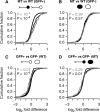
Differential expression of conserved and nonconserved miR-124 targets. Shown are the cumulative distributions of log2-fold differences in the expression of genes with 3′UTRs harboring at least one conserved target site (light grey), exclusively nonconserved target sites (dark grey) or no seed match (black). Only seed matches with a t8 match were considered target sites. Two-sided empirical P-values were obtained by comparing the mean expression level of targets to the mean expression levels of 10 000 cohorts of control genes (see ‘Materials and Methods’ section). Shown are data for the comparison between mir-124 mutant and wild-type GFP+ (A) and GFP− (B) cells. Observed changes in expression for conserved and nonconserved targets differed from those for control genes in GFP+ cells but not in GFP− cells. (C and D) Shown are the cumulative distributions of log2 fold differences between GFP+ and GFP− cells in wild-type (C) and mutant animals (D), otherwise as in previous panels.
Figure 6.
Figure 6.
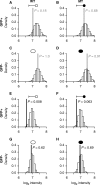
Absolute expression levels of conserved and nonconserved miR-124 targets. Differential expression was assessed by comparing the mean log2 intensities of targets to the mean log2 intensities of 10 000 cohorts of control genes (see ‘Materials and Methods’ section). Mean log2 intensities for the control sets were plotted as histograms. Vertical light grey and dark grey lines indicate the mean log2 intensity of conserved (A–D) and nonconserved targets (E–H), respectively.
Figure 7.
Figure 7.
Overview of the 50 miR-124 targets that showed greatest evidence for differential expression between mutant and wild-type GFP+ cells based on the B-statistic. Expression differences are shown for the comparison between mutant and wild-type GFP+ cells (A), mutant and wild-type GFP− cells (B) and mir-124 expressing and nonexpressing cells in wild-type animals (C). Error bars are standard errors of the mean. Light grey and dark grey indicate conserved and nonconserved targets, respectively. (D) Published expression patterns based on promoter::GFP fusions. A black box indicates reported expression for a specific tissue. Asterisks indicate reported expression based on immunohistochemistry. Numbers in the right margin correspond to relevant publications (84,87–105).

Similar articles

Cited by

References

    1. Sharp PA. The centrality of RNA. Cell. 2009;136:577–580. - PubMed
    1. Arazi T, Talmor-Neiman M, Stav R, Riese M, Huijser P, Baulcombe DC. Cloning and characterization of micro-RNAs from moss. Plant J. 2005;43:837–848. - PubMed
    1. Lagos-Quintana M, Rauhut R, Lendeckel W, Tuschl T. Identification of novel genes coding for small expressed RNAs. Science. 2001;294:853–858. - PubMed
    1. Lau NC, Lim LP, Weinstein EG, Bartel DP. An abundant class of tiny RNAs with probable regulatory roles in Caenorhabditis elegans. Science. 2001;294:858–862. - PubMed
    1. Lee RC, Ambros V. An extensive class of small RNAs in Caenorhabditis elegans. Science. 2001;294:862–864. - PubMed

Publication types