

Intracellular transactivation of HIV can account for the decelerating decay of virus load during drug therapy
- PMID: 20160709
- PMCID: PMC2835566
- DOI: 10.1038/msb.2010.4
Intracellular transactivation of HIV can account for the decelerating decay of virus load during drug therapy
Abstract
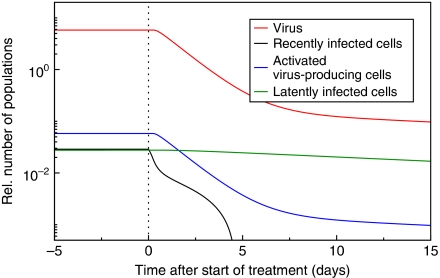
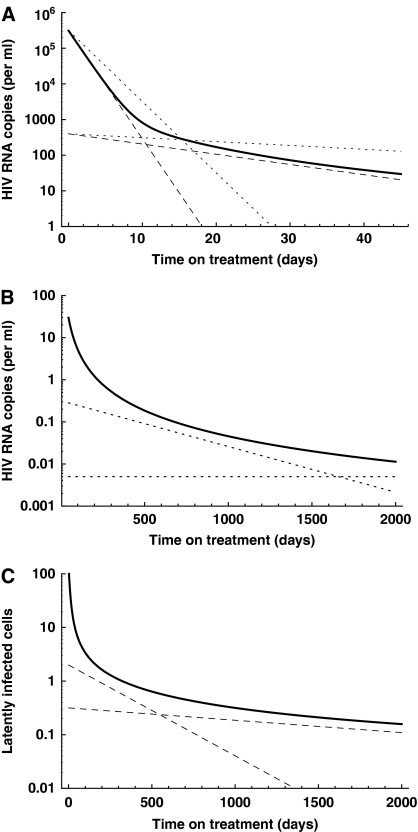
Basic virus dynamics models have been essential in understanding quantitative issues of HIV replication. However, several parts of the viral life cycle remain elusive. One of the most critical steps is the start of viral transcription, which is governed by the regulatory protein trans-activator of transcription (Tat) that induces a positive feedback loop. It has been shown that this feedback loop can alternate between two states leading to a transient activation of viral transcription. Using Monte Carlo simulations, we integrate the transactivation circuit into a new virus dynamics model having an age-dependent transactivation rate and reversion into latency. The cycling of infected cells between an activated and latent state results in the typical decelerating decay of virus load following therapy. Further, we hypothesize that the activation of latently infected cells is governed by the basal transcription rate of the integrated provirus rather than the intra- or extracellular environment. Finally, our systems approach to modeling virus dynamics offers a promising framework to infer the extracellular dynamics of cell populations from their intracellular reaction networks.
Conflict of interest statement
The authors declare that they have no conflict of interest.
Figures

Similar articles
-
Probabilistic control of HIV latency and transactivation by the Tat gene circuit.Proc Natl Acad Sci U S A. 2018 Dec 4;115(49):12453-12458. doi: 10.1073/pnas.1811195115. Epub 2018 Nov 19. Proc Natl Acad Sci U S A. 2018. PMID: 30455316 Free PMC article.
-
Stochastic Dynamics of the Latently Infected Cell Reservoir During HIV Infection.Bull Math Biol. 2019 Jan;81(1):131-154. doi: 10.1007/s11538-018-0520-5. Epub 2018 Oct 8. Bull Math Biol. 2019. PMID: 30298198
-
Modeling the effect of tat inhibitors on HIV latency.J Theor Biol. 2019 Jul 21;473:20-27. doi: 10.1016/j.jtbi.2019.04.018. Epub 2019 Apr 17. J Theor Biol. 2019. PMID: 31004612
-
Recent advances in the identification of Tat-mediated transactivation inhibitors: progressing toward a functional cure of HIV.Future Med Chem. 2016;8(4):421-42. doi: 10.4155/fmc.16.3. Epub 2016 Mar 2. Future Med Chem. 2016. PMID: 26933891 Review.
-
The Tat/P-TEFb Protein-Protein Interaction Determining Transcriptional Activation of HIV.Curr Pharm Des. 2017;23(28):4091-4097. doi: 10.2174/1381612823666170710164148. Curr Pharm Des. 2017. PMID: 28699519 Review.
Cited by
-
Contribution of follicular dendritic cells to persistent HIV viremia.J Virol. 2013 Jul;87(14):7893-901. doi: 10.1128/JVI.00556-13. Epub 2013 May 8. J Virol. 2013. PMID: 23658450 Free PMC article.
-
Quantification of viral infection dynamics in animal experiments.Front Microbiol. 2013 Sep 10;4:264. doi: 10.3389/fmicb.2013.00264. Front Microbiol. 2013. PMID: 24058361 Free PMC article. Review.
-
Latency profiles of full length HIV-1 molecular clone variants with a subtype specific promoter.Retrovirology. 2011 Sep 16;8:73. doi: 10.1186/1742-4690-8-73. Retrovirology. 2011. PMID: 21923919 Free PMC article.
-
Implications of CTL-mediated killing of HIV-infected cells during the non-productive stage of infection.PLoS One. 2011 Feb 7;6(2):e16468. doi: 10.1371/journal.pone.0016468. PLoS One. 2011. PMID: 21326882 Free PMC article.
-
Variation of TNF modulates cellular immunity of gregarious and solitary locusts against fungal pathogen Metarhizium anisopliae.Proc Natl Acad Sci U S A. 2022 Feb 8;119(6):e2120835119. doi: 10.1073/pnas.2120835119. Proc Natl Acad Sci U S A. 2022. PMID: 35110413 Free PMC article.
References
-
- Brooks DG, Hamer DH, Arlen PA, Gao L, Bristol G, Kitchen CMR, Berger EA, Zack JA (2003) Molecular characterization, reactivation, and depletion of latent HIV. Immunity 19: 413–423 - PubMed
-
- Bucy RP (1999) Immune clearance of HIV type 1 replication-active cells: a model of two patterns of steady state HIV infection. AIDS Res Hum Retroviruses 15: 223–227 - PubMed
Publication types
MeSH terms
Substances
LinkOut - more resources
Full Text Sources
Medical
