. 2010 Mar;42(3):229-33.
doi: 10.1038/ng.533. Epub 2010 Feb 14.

Germline mutations in TMEM127 confer susceptibility to pheochromocytoma

Affiliations

Germline mutations in TMEM127 confer susceptibility to pheochromocytoma

Yuejuan Qin et al. Nat Genet. 2010 Mar.

Abstract

Pheochromocytomas, which are catecholamine-secreting tumors of neural crest origin, are frequently hereditary. However, the molecular basis of the majority of these tumors is unknown. We identified the transmembrane-encoding gene TMEM127 on chromosome 2q11 as a new pheochromocytoma susceptibility gene. In a cohort of 103 samples, we detected truncating germline TMEM127 mutations in approximately 30% of familial tumors and about 3% of sporadic-appearing pheochromocytomas without a known genetic cause. The wild-type allele was consistently deleted in tumor DNA, suggesting a classic mechanism of tumor suppressor gene inactivation. Pheochromocytomas with mutations in TMEM127 are transcriptionally related to tumors bearing NF1 mutations and, similarly, show hyperphosphorylation of mammalian target of rapamycin (mTOR) effector proteins. Accordingly, in vitro gain-of-function and loss-of-function analyses indicate that TMEM127 is a negative regulator of mTOR. TMEM127 dynamically associates with the endomembrane system and colocalizes with perinuclear (activated) mTOR, suggesting a subcompartmental-specific effect. Our studies identify TMEM127 as a tumor suppressor gene and validate the power of hereditary tumors to elucidate cancer pathogenesis.


Figures

Fig.1
Fig.1. TMEM127 localizes to the plasma membrane and cytoplasm
A) Western blot of HEK293 cells transfected with wild-type TMEM127 tagged with the Flag epitope at the C-terminus (C-Flag-TMEM127), N-terminus (N-Flag-TMEM127), and N-tagged TMEM127 mutants M158 (#3, Fig. 1C) and M99 (#6, Fig.1C) or empty MSCV retroviral vector (EV) and probed with a Flag antibody. A detectable product cannot be obtained from mutant constructs. β-actin was used as a loading control. B) Western blot of 293 cells transfected with TMEM127 tagged with HA at the N-terminus (HA-TMEM127) or the N-Flag-TMEM127 construct shown in (A), with respective empty vector controls, probed with an HA (left) or Flag (right) antibody. β-actin was used as a loading standard. C) Confocal microscopy of HEK293T cells expressing wild-type TMEM127 tagged with Flag on the N-terminus (left) or C-terminus (central) or with an HA N-terminal tag (right). TMEM127 immunoreactivity determined by Flag or HA (red) is present both at the plasma membrane (illustrated on the left panel) and cytoplasm, with punctate (middle and right panels) or perinuclear (right panel, arrows) signals, but is absent from the nucleus (DAPI, blue). These distinct staining patterns were observed with the various constructs in at least three independent experiments (Suppl. Fig. 4B). Plasma membrane-associated TMEM127 distribution was detected on average in 38% (±13%, n=200) of cells under regular culture conditions. A similar variance in the percentage of plasma membrane associated-signal was noted for each of the constructs.
Fig. 2
Fig. 2. TMEM127 colocalizes with multiple components of the endomembrane system
Confocal images of HA-TMEM127-transfected HEK293E cells fixed and immunofluorescently labeled with either the early endosome marker Rab5 antibody [red, (A)] or the Golgi marker syntaxin 6 [red, (B), HA antibody (green) and DAPI (blue)]. Regions identified by the white-dashed rectangles are presented at higher magnification in the right and lower panels. Middle panels: separate presentations of the red and green channel images. Lower panels: overlap (yellow) of red and green pixels, irrespective of their intensity. Right image panel presents intensity values of the product of the difference of the means (PDMs). Positive PDMs identify pixels where intensities in the red and green channels vary in synchrony. Perfectly synchronous signals would be indicated with a PDM value of 1. Completely asynchronous signals would have a value of −1. The PDM intensity scale ranges from the minimum to maximum values within each image panel, −0.5 to 0.5 in A and −0.6 to 0.6 in B. Optical sections are ~0.4 μm thick. Bars are 2 μm. These results were representative of multiple cells assessed in independent experiments. C) HEK293E cells stably transfected with HA-TMEM127 were left untreated (top) or were cultured in the presence of a potassium-depleting buffer (bottom), as described in Methods. Cells were fixed and stained with antibodies specific for HA (green) or, Rab5 (red) before imaging. DAPI (blue) represents nuclei. An increase in plasma-membrane associated TMEM127 and control Rab5 is seen after inhibition of endocytosis promoted by this treatment. Bars are 10μm. D) HEK293E cells stably transfected with HA-TMEM127 were left untreated (top) or were exposed to 50mM ammonium chloride (bottom) for 2 h. Cells were fixed and stained with antibodies specific for HA (green) or Rab5 (red) before imaging. DAPI (blue) represents nuclei. Expansion of endosomal structures is seen both for HA-TMEM127 and Rab5. Bars are 5μm.
Fig.3
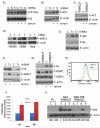
Fig.3. TMEM127 modulates mTORC1 signaling in vitro and in vivo
A) RAS activation measured by a RAS pull down assay (RAS-GTP expression) of 293E cells with TMEM127 knockdown by two independent shRNA sequences( T1 and T2), or a control knockdown (C) in the absence or after 10 minutes of serum exposure. Total RAS is shown as sample loading control. Effectiveness of the serum treatment is shown in Suppl. Fig. 7A; B) AKT phosphorylation in TMEM127 (T1) or GFP (C) knockdown 293 cells in the presence or absence of serum; β-actin is a loading control; C) Phosphorylation of mTORC2 target AKT in 293E cells overexpressing HA-tagged TMEM127 (TMEM127) or an empty vector (V) in the presence or absence of serum. β-actin is a loading control; D) Effects of transient TMEM127 knockdown (T) on 4EBP1 phosphorylation in HEK293, A2058 and HeLa cells. C=GFP control knockdown. β-actin is a loading control; E) Phosphorylation of mTORC1 targets S6K and S6 in 293E cells depleted for TMEM127 by two independent shRNA sequences (T1 and T2); C=GFP control knockdown; F) Effects of TMEM127 knockdown (T1) on 4EBP1 and S6 phosphorylation in HEK293 in the presence or absence of 10% serum. C=GFP control knockdown; G) Phosphorylation of mTORC1 targets, as above, in 293E cells expressing HA-tagged TMEM127 (TMEM127) or a control HA-empty vector (V); T-4EBP1 = total 4EBP1. H) Forward scatter FACS analysis of TMEM127 (T1) or control (C) knockdown in HEK293 cells. Ungated results are displayed and are similar to profiles obtained at the G1 and G2 phases of the cell cycle. I) Proliferation of TMEM127 or control knockdown 293E cells measured at the indicated time points after serum addition in cells serum-starved overnight using a DNA-bound fluorescence assay(P<0.002, t-test). Error bars are ±SE of triplicate experiments J) Phosphorylation levels of S6K in pheochromocytoma lysates. Two normal adrenal medulla samples (lanes 1 and 2) were compared with tumor lysates from TMEM127 mutant (Mut TMEM127) samples (lanes 3, 4 and 5, corresponding to samples from family 5, 6 and 1, respectively) and four tumors with wild-type TMEM127 sequence (WT TMEM127), including two sporadic samples (lanes 6 and 7), one tumor from neurofibromatosis type 1 (lane 8) and one VHL-mutant tumor (lane 9). Densitometric measurements of the bands in relation to β-actin are displayed below each lane (lane 3 ratio was set to 1).
Fig.4
Fig.4. TMEM127 colocalizes with amino acid-activated mTORC1
A) Effect of 1-hour amino acid (AA) starvation, followed or not by replenishment (15 min), on S6K phosphorylation of 293E cells with TMEM127 knockdown by two independent shRNA sequences, T1 and T2. A control knockdown (C) is shown for comparison. B) Effect of amino acid (AA) treatment as in "A" on 4EBP1 phosphorylation of 293E cells overexpressing HA-TMEM127 or empty vector (EV). HA indicates TMEM127 expression. β-actin is the loading control. P-S6K, phosphorylated S6 kinase at residue T389; P-4EBP1, phosphorylated 4EBP1 at residues T37-46; S6K, total S6 kinase. C) HEK293T cells co-transfected with HA-TMEM127 and myc-mTOR were serum-starved overnight, depleted of amino acids for 1h followed by reexposure for 15 minutes (AA+). Cells were fixed and stained with antibodies specific for HA (green), myc (red) or DAPI (blue) before imaging. myc-mTOR is diffusely present in the cytoplasm in the absence of amino acid and becomes localized to a perinuclear region where TMEM127 is detected upon amino acid exposure. Similar results were obtained with two independent TMEM127 constructs. Bars, 5μm.

Similar articles

Cited by

References

    1. Amar L, et al. Genetic testing in pheochromocytoma or functional paraganglioma. J Clin Oncol. 2005;23:8812–8. - PubMed
    1. Dahia PL. Evolving concepts in pheochromocytoma and paraganglioma. Curr Opin Oncol. 2006;18:1–8. - PubMed
    1. Dahia PLM, et al. Novel Pheochromocytoma Susceptibility Loci Identified by Integrative Genomics. Cancer Res. 2005;65:9651–9658. - PubMed
    1. Sjoblom T, et al. The consensus coding sequences of human breast and colorectal cancers. Science. 2006;314:268–74. - PubMed
    1. Neumann HP, et al. Germ-line mutations in nonsyndromic pheochromocytoma. N Engl J Med. 2002;346:1459–66. - PubMed

Publication types

Associated data