Comparative Study
. 2010 Jan 28;65(2):191-203.
doi: 10.1016/j.neuron.2010.01.011.

Hook3 interacts with PCM1 to regulate pericentriolar material assembly and the timing of neurogenesis

Affiliations
Comparative Study

Hook3 interacts with PCM1 to regulate pericentriolar material assembly and the timing of neurogenesis

Xuecai Ge et al. Neuron. .

Abstract

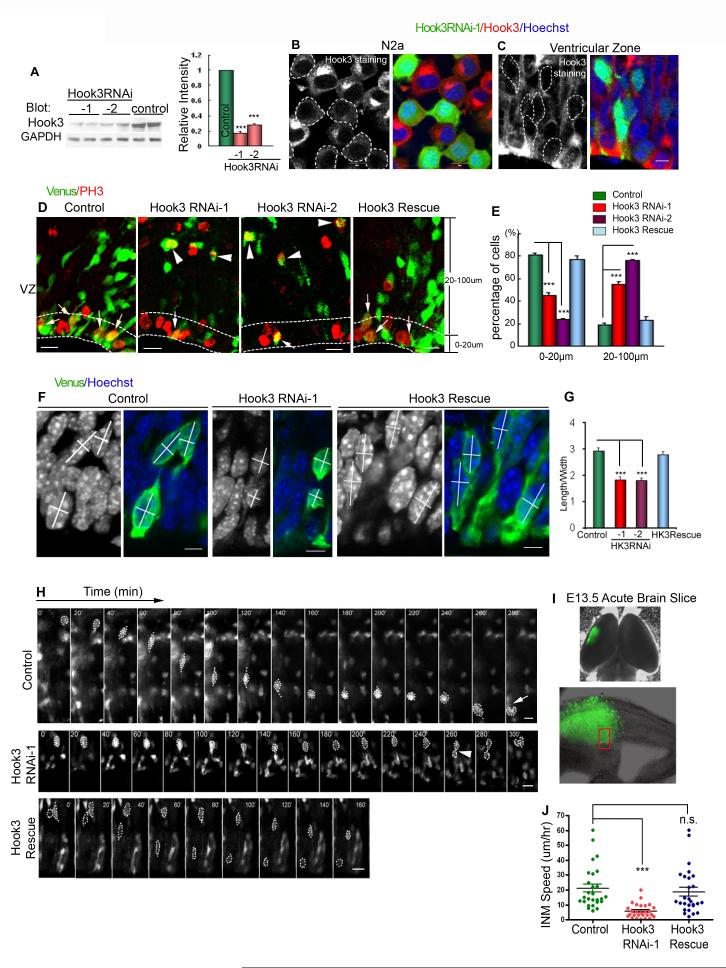
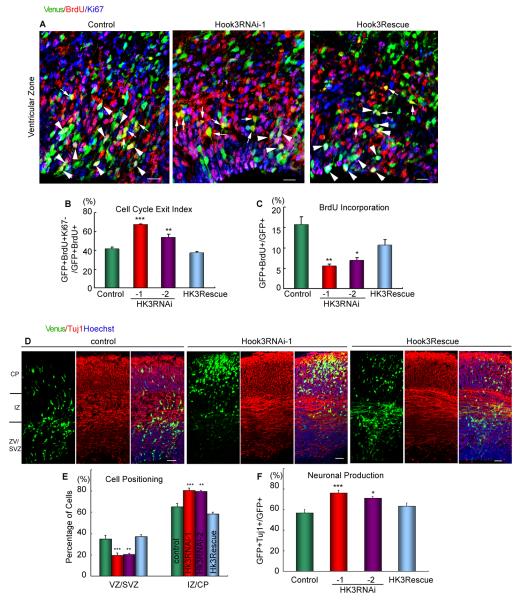
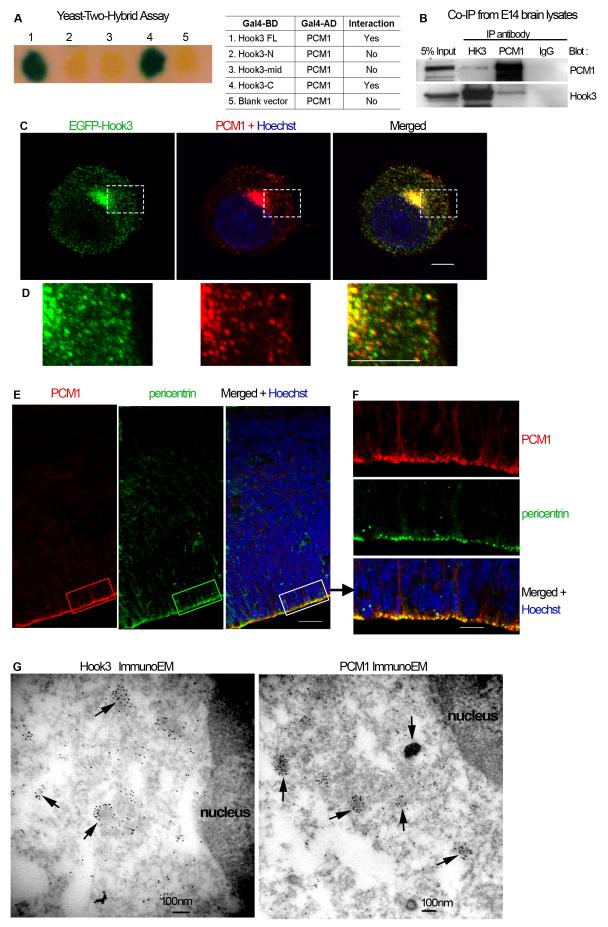
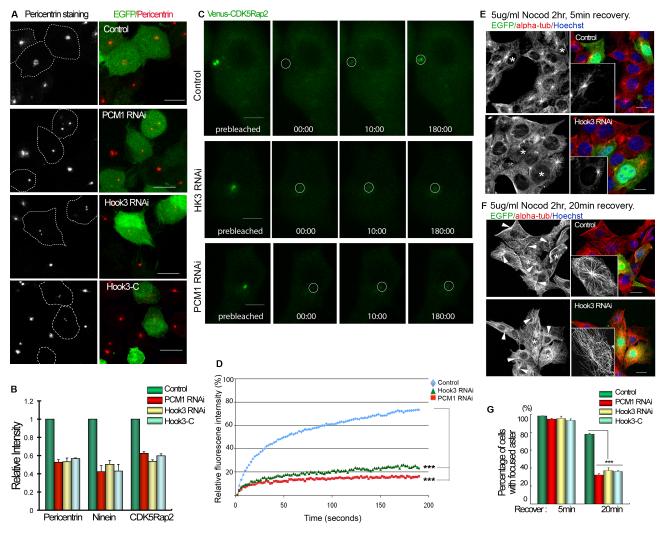
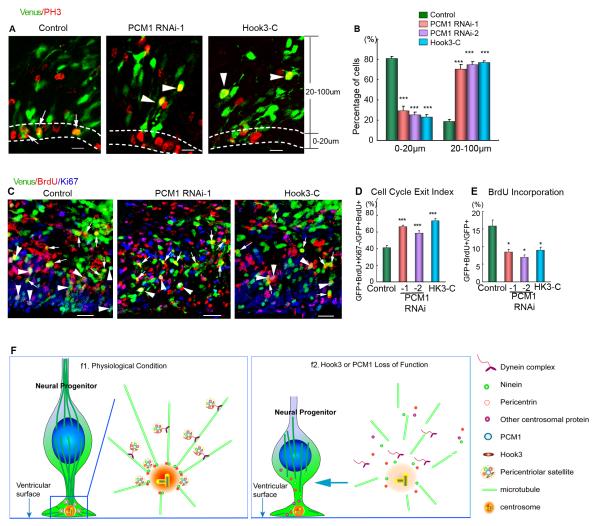
Centrosome functions are important in multiple brain developmental processes. Proper functioning of the centrosome relies on assembly of protein components into the pericentriolar material. This dynamic assembly is mediated by the trafficking of pericentriolar satellites, which are comprised of centrosomal proteins. Here we demonstrate that trafficking of pericentriolar satellites requires the interaction between Hook3 and Pericentriolar Material 1 (PCM1). Hook3, previously shown to link the centrosome and the nucleus in C. elegans, is recruited to pericentriolar satellites through interaction with PCM1, a protein associated with schizophrenia. Disruption of the Hook3-PCM1 interaction in vivo impairs interkinetic nuclear migration, a featured behavior of embryonic neural progenitors. This in turn leads to overproduction of neurons and premature depletion of the neural progenitor pool in the developing neocortex. These results underscore the importance of centrosomal assembly in neurogenesis and provide potential insights into the etiology of brain developmental diseases related to the centrosome dysfunction.


Figures

Figure 1
Figure 1. Mouse Hook3 localizes to the periphery of the centrosome
(A) Western blot of brain lysates from various developmental stages. (B) Immunostaining of E14 brain sections. Hook3 (green) is highly expression in CP and VZ. In the VZ, Hook3 is expressed by nestin-positive neural progenitors. (C) Diagram of en face view of the ventricular surface. (D) En face view of Hook3 expression pattern at the ventricular surface. (E) N2A cells immunostained for Hook3 and pericentrin. The enlarged cell shows that Hook3 localizes to granular structures that concentrate to the centrosome. Scale bars: 50 μm in B; 10 μm in D-E. See also Figure S1.
Figure 2
Figure 2. Hook3 regulates interkinetic nuclear migration (INM)
(A) Hook3 RNAi silenced endogenous protein expression in N2A cells three days after transfection. Densitometry was performed with ImageJ software (n=4). (B-C) Immunostaining of N2A cells and brain slices 3 days after Hook3 RNAi transfection. Hook3 protein levels are lower in cells transfected with Hook3 RNAi (dashed circles). In Figure D-F, in utero electroporations were performed at E11.5 and brains were examined at E14.5. (D-E) Hook3 knockdown leads to mitosis away from the ventricular surface. Mitosis within 20 μm (indicated by dashed lines) from the ventricular surface is considered apical division, and mitosis in the 20-100 μm zone is considered ectopic cell division (n=3-4). (F) Nuclei assume round shapes after Hook3 knockdown. (G) Quantification showing the ratio of nuclear length to width (indicated by white lines in F) (n=15-18). (H-J) Hook3 knockdown impairs INM in acute brain slices. Mice were electroporated at E11.5 and sacrificed at E13.5. (H) Time-lapse video sequences of cells undergoing INM in control, Hook3 RNAi, and Hook3-rescued cortical slices. Ventricular surface is located at the bottom of the images. Time is denoted in the upper left corner. Cell bodies are delineated by dashed lines. Arrows indicate mitosis at the apical surface; arrowheads indicate ectopic mitosis. The red box in (I) represents the imaging area (n=27). Data are presented as mean±SEM. **p<0.01, ***p<0.001, one-way ANOVA. Scale bars: 10 μm in B-C, F; 20 μm in D and H.
Figure 3
Figure 3. Hook3 is required for maintenance of the neural progenitor pool
(A) Mice were electroporated at E11.5, pulse labeled with BrdU at E13.5, and sacrificed at E14.5. Brain sections were then stained with antibodies against BrdU, Ki67 (blue), and GFP (green). GFP-positive cells labeled with both BrdU and Ki67 (white arrowheads) remain in the cell cycle; GFP-positive cells labeled with BrdU but not Ki67 (white arrows) have exited the cell cycle. Total BrdU incorporation in transfected cells (sum of arrows and arrow heads) decreases after Hook3 knockdown. (B) Quantification of cell cycle exit index (n=5-7). (C) Quantification of BrdU incorporation index (n=5-7). (D) Mice were electroporated at E11.5 and sacrificed at E14.5. Hook3 knockdown leads to a higher percentage of transfected cells that have migrated to the CP and IZ, and a lower percentage of cells remaining in the VZ and SVZ. (E) Quantification of cell positioning (n=3-5). (F) Quantification of Tuj1-positive cells (n=3-5). Data are presented as mean ± SEM. *p < 0.05, **p <0.01, ***p<0.001(one-way ANOVA). Scale bars: 20 μm in A; 50 μm in D.
Figure 4
Figure 4. Hook3 interacts with PCM1 and localizes to pericentriolar satellites
(A) β-gal assay using the yeast-two-hybrid system. Fragments of Hook3 were fused with the gal4-binidng domain, and PCM1 was fused with the gal4-activating domain. Blue colonies indicate that the two proteins interact. Hook3-N: N-terminal 170aa; Hook3-C: C-terminal 170aa; Hook3-mid: the remaining middle portion of the protein. (B) Co-IP results using E14 brain lysates. (C) EGFP-Hook3 was overexpressed in N2A cells and the cells were stained with anti-PCM1. (D) Enlarged square area in (C) showing the overlap of EGFP-Hook3 and PCM1 immunofluorescence. (E) Vibratome sections (50 μm) were stained with PCM1 and pericentrin (green) antibodies. PCM1 highlights the apical surface of the VZ. (F) Boxed area in (E) showing the overlap of PCM1 with pericentrin at the ventricular surface. (G) Immunogold EM analysis of N2A cells revealed that Hook3 and PCM1 localize to pericentriolar satellites (black arrows). Gold particles were 5nm. Scale bars: 5 μm in C, D; 50 μm in E; 30 in F; 100 nm in G.
Figure 5
Figure 5. Hook3-PCM1 interaction is necessary for the proper functioning of pericentriolar satellites
(A) GFP-PCM1 and flag-tagged Hook3 fragments were co-expressed in N2A cells. Only Hook3-C co-immunoprecipitates with PCM1. (B) Hook3-C affects the interaction between Hook3 and PCM1 in a dominant negative manner. GFP-PCM1 and flag-Hook3 were transfected at a constant ratio, while myc-Hook3C was transfected at increasing levels (0 to 6-fold of myc-Hook3). (C) Diagram showing that the C-terminus of Hook3 binds to PCM1. (D) N2A cells were transfected with control or Hook3 RNAi together with EGFP and stained with PCM1 antibody. PCM1 disperses from the centrosome after Hook3 knockdown. (E) N2A cells transfected with flag-Hook3C and stained with anti-flag (green) and anti-PCM1 antibodies. Hook3C shows diffusive distribution throughout the cytoplasm, and it also disperses PCM1 from the centrosome. (F) PCM1 RNAi similarly disperses Hook3 from the centrosome. (G) The same batch of cells in (D-E) were lysed and subjected to western blot. Total PCM1 levels do not change after Hook3 knockdown or Hook3-C overexpression. (H) Conventional EM images. Pericentriolar satellites (black arrows) were identified as electron dense granules surrounding the centrosome. (I) The zoomed-in image of the square area in the control cell, showing representative pericentriolar satellites surrounding the centrosome. (J) Quantification of pericentriolar satellites on 16 μm2 square size with the centrosome in the center (n=7, 13, 9, 10 for control, Hook3 RNAi, PCM1 RNAi, Hook3-C respectively). Data are presented as mean ± SEM.***p<0.001 (Mann-Whitney test). Scale bars: 10 μm in D-F; 500 nm in H. centrosm: centrosome. PS: pericentriolar satellite.
Figure 6
Figure 6. Hook3-PCM1 interaction is required for centrosomal protein assembly and microtubule anchorage to the centrosome
(A) N2A cells were transfected with corresponding constructs (circled by white dashed lines), and immunostained with an antibody against pericentrin. Images are projections of confocal image stacks. (B) Relative intensities of pericentrin, ninein, and CDk5Rap2 at the centrosome. Ratio represents protein intensity in the centrosome over that at the cell periphery. Measurements were performed with ImageJ (n=30-40 cells). (C) Venus-CDK5rap2 was expressed in NIH3T3 cells together with corresponding constructs. FRAP experiments were performed on cells with low expression levels to avoid protein aggregates. Time labels indicate time after photobleaching. (D) Quantification of venus-CDK5rap2 recovery after photobeaching. Each data point represents the average intensity of 8 cells. (E) NIH3T3 cells were transfected with corresponding constructs (transfected cells are marked by white stars). 3 days later, cells were incubated with 5ug/ml nocodazole for 2 hr. After a 5 minute recovery period, most cells have a well-focused microtubule aster, indicating that microtubule nucleation is normal. Insets are zoom-in images of representative cells with newly formed microtubule asters. (F) After a 20 minute recovery period, control cells have a well focused radial microtubule structures (arrow heads, and inset), whereas in Hook3 knockdown cells, microtubules are unfocused (inset). (G) Quantification of cells with focused microtubule asters. (n=3, 150-200 cells are quantified). Data are presented as mean ± SEM.***p<0.001(one-way ANOVA). Scale bars: 10μm. See also Figure S3 and S4.
Figure 7
Figure 7. PCM1-Hook3 interaction is required for INM and maintenance of the neural progenitor pool
(A) PCM1 knockdown leads to mitosis away from the ventricular surface. White arrows mark apical divisions; arrowheads marked ectopic division. (B) Quantification of the distribution of PH3-positive cells in different zones (n=3-4). (C) Cell cycle exit assay. See Figure 3A for experimental procedure. (D) Cell cycle exit index (n=4-7). (E) BrdU incorporation index (n=4-7). (F) A model to explain functions of Hook3 and PCM1 in neural progenitors. (f1) In physiological conditions, PCM1 functions as a scaffold and recruits multiple proteins, including Hook3, to form pericentriolar satellites. Pericentriolar satellites are subsequently transported along microtubules in a dynein-dependent manner, and finally deliver the proteins to the centrosome. (f2) Under conditions of Hook3 or PCM1 loss of function, or after the Hook3-PCM1 interaction is disrupted, the assembly or transport of pericentriolar satellites is impaired. This leads to defects in the dynamic assembly of the centrosome. Subsequently, various centrosome functions are compromised, including its ability to organize microtubules. The net result is the disruption of INM, which eventually results in neurogenesis defects. Data are presented as mean ± SEM. *p<0.05, **p<0.01, ***p<0.001, one-way ANOVA. Scale bars: 20 μm in A; 50 μm in C. See also Figure S5.

Similar articles

Cited by

References

    1. Badano JL, Teslovich TM, Katsanis N. The centrosome in human genetic disease. Nat Rev Genet. 2005;6:194–205. - PubMed
    1. Balczon R, Bao L, Zimmer WE. PCM-1, A 228-kD centrosome autoantigen with a distinct cell cycle distribution. J Cell Biol. 1994;124:783–793. - PMC - PubMed
    1. Baron AT, Salisbury JL. Identification and localization of a novel, cytoskeletal, centrosome-associated protein in PtK2 cells. J Cell Biol. 1988;107:2669–2678. - PMC - PubMed
    1. Baron AT, Suman VJ, Nemeth E, Salisbury JL. The pericentriolar lattice of PtK2 cells exhibits temperature and calcium-modulated behavior. J Cell Sci. 1994;107(Pt 11):2993–3003. - PubMed
    1. Berns MW, Rattner JB, Brenner S, Meredith S. The role of the centriolar region in animal cell mitosis. A laser microbeam study. J Cell Biol. 1977;72:351–367. - PMC - PubMed

Publication types

MeSH terms