Small molecule hydration free energies in explicit solvent: An extensive test of fixed-charge atomistic simulations
- PMID: 20150953
- PMCID: PMC2701304
- DOI: 10.1021/ct800409d
Small molecule hydration free energies in explicit solvent: An extensive test of fixed-charge atomistic simulations
Abstract
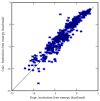
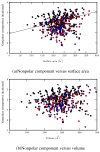
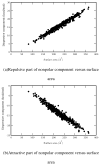
Using molecular dynamics free energy simulations with TIP3P explicit solvent, we compute the hydration free energies of 504 neutral small organic molecules and compare them to experiments. We find, first, good general agreement between the simulations and the experiments, with an RMS error of 1.24 kcal/mol over the whole set (i.e., about 2 kT) and a correlation coefficient of 0.89. Second, we use an automated procedure to identify systematic errors for some classes of compounds, and suggest some improvements to the force field. We find that alkyne hydration free energies are particularly poorly predicted due to problems with a Lennard-Jones well depth, and find that an alternate choice for this well depth largely rectifies the situation. Third, we study the non-polar component of hydration free energies - that is, the part that is not due to electrostatics. While we find that repulsive and attractive components of the non-polar part both scale roughly with surface area (or volume) of the solute, the total non-polar free energy does not scale with the solute surface area or volume, because it is a small difference between large components and is dominated by the deviations from the trend. While the methods used here are not new, this is a more extensive test than previous explicit solvent studies, and the size of the test set allows identification of systematic problems with force field parameters for particular classes of compounds. We believe that the computed free energies and components will be valuable to others in future development of force fields and solvation models.
Figures


Similar articles
-
Computations of Absolute Solvation Free Energies of Small Molecules Using Explicit and Implicit Solvent Model.J Chem Theory Comput. 2009 Apr 14;5(4):919-30. doi: 10.1021/ct800445x. Epub 2009 Mar 24. J Chem Theory Comput. 2009. PMID: 26609601
-
Comparison of charge models for fixed-charge force fields: small-molecule hydration free energies in explicit solvent.J Phys Chem B. 2007 Mar 8;111(9):2242-54. doi: 10.1021/jp0667442. Epub 2007 Feb 10. J Phys Chem B. 2007. PMID: 17291029
-
Predicting Solvation Free Energies from the Minnesota Solvation Database Using Classical Density Functional Theory Based on the PC-SAFT Equation of State.J Phys Chem B. 2024 Apr 18;128(15):3677-3688. doi: 10.1021/acs.jpcb.3c07447. Epub 2024 Apr 5. J Phys Chem B. 2024. PMID: 38579126
-
Identifying Systematic Force Field Errors Using a 3D-RISM Element Counting Correction.Molecules. 2023 Jan 17;28(3):925. doi: 10.3390/molecules28030925. Molecules. 2023. PMID: 36770599 Free PMC article.
-
Blind prediction of solvation free energies from the SAMPL4 challenge.J Comput Aided Mol Des. 2014 Mar;28(3):135-50. doi: 10.1007/s10822-014-9718-2. Epub 2014 Mar 11. J Comput Aided Mol Des. 2014. PMID: 24615156 Free PMC article. Review.
Cited by
-
Water Determines the Structure and Dynamics of Proteins.Chem Rev. 2016 Jul 13;116(13):7673-97. doi: 10.1021/acs.chemrev.5b00664. Epub 2016 May 17. Chem Rev. 2016. PMID: 27186992 Free PMC article. Review.
-
Toward Improved Force-Field Accuracy through Sensitivity Analysis of Host-Guest Binding Thermodynamics.J Phys Chem B. 2015 Aug 13;119(32):10145-55. doi: 10.1021/acs.jpcb.5b04262. Epub 2015 Aug 5. J Phys Chem B. 2015. PMID: 26181208 Free PMC article.
-
Intrinsically disordered regions may lower the hydration free energy in proteins: a case study of nudix hydrolase in the bacterium Deinococcus radiodurans.PLoS Comput Biol. 2010 Jul 15;6(7):e1000854. doi: 10.1371/journal.pcbi.1000854. PLoS Comput Biol. 2010. PMID: 20657662 Free PMC article.
-
Rapid prediction of solvation free energy. 3. Application to the SAMPL2 challenge.J Comput Aided Mol Des. 2010 Apr;24(4):373-83. doi: 10.1007/s10822-010-9341-9. Epub 2010 Apr 6. J Comput Aided Mol Des. 2010. PMID: 20414699
-
Alchemical free energy methods for drug discovery: progress and challenges.Curr Opin Struct Biol. 2011 Apr;21(2):150-60. doi: 10.1016/j.sbi.2011.01.011. Epub 2011 Feb 23. Curr Opin Struct Biol. 2011. PMID: 21349700 Free PMC article. Review.
References
-
- Rizzo RC, Aynechi T, Case DA, Kuntz ID. J Chem Theory Comput. 2006;2:128–139. - PubMed
-
- Bordner AJ, Cavasotto CN, Abagyan RA. J Phys Chem B. 2002;106:11009–11015.
-
- Thompson JD, Cramer CJ, Truhlar DG. J Phys Chem A. 2004;108:6532–6542.
-
- Nicholls A, Mobley DL, Guthrie JP, Chodera JD, Bayly CI, Cooper MD, Pande VS. J Med Chem. 2008;51:769–778. - PubMed
Grants and funding
LinkOut - more resources
Full Text Sources
Other Literature Sources
