. 2010 Feb 10;30(6):2115-29.
doi: 10.1523/JNEUROSCI.4517-09.2010.

Neuroligin-1 deletion results in impaired spatial memory and increased repetitive behavior

Affiliations

Neuroligin-1 deletion results in impaired spatial memory and increased repetitive behavior

Jacqueline Blundell et al. J Neurosci. .

Abstract

Neuroligins (NLs) are a family of neural cell-adhesion molecules that are involved in excitatory/inhibitory synapse specification. Multiple members of the NL family (including NL1) and their binding partners have been linked to cases of human autism and mental retardation. We have now characterized NL1-deficient mice in autism- and mental retardation-relevant behavioral tasks. NL1 knock-out (KO) mice display deficits in spatial learning and memory that correlate with impaired hippocampal long-term potentiation. In addition, NL1 KO mice exhibit a dramatic increase in repetitive, stereotyped grooming behavior, a potential autism-relevant abnormality. This repetitive grooming abnormality in NL1 KO mice is associated with a reduced NMDA/AMPA ratio at corticostriatal synapses. Interestingly, we further demonstrate that the increased repetitive grooming phenotype can be rescued in adult mice by administration of the NMDA receptor partial coagonist d-cycloserine. Broadly, these data are consistent with a role of synaptic cell-adhesion molecules in general, and NL1 in particular, in autism and implicate reduced excitatory synaptic transmission as a potential mechanism and treatment target for repetitive behavioral abnormalities.


Figures
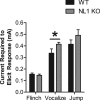
Figure 1.
Figure 1.
NL1 KO mice exhibit mixed responses to painful stimuli. When footshocks were delivered through a metal grid floor at increasing currents, the amount of current required to elicit flinching [two-way ANOVA, genotype (between-subjects factor), p = 0.78; sex (between-subjects factor), p = 0.54; genotype × sex interaction, p = 0.29] and jumping [two-way ANOVA, genotype (between-subjects factor), p = 0.34; sex (between-subjects factor), p = 0.62; genotype × sex interaction, p = 0.45] behaviors was similar for both WT and NL1 KO mice. Compared with WT mice, NL1 KO mice required a higher current threshold to elicit vocalizations [two-way ANOVA, genotype (between-subjects factor), *p < 0.0.020; sex (between-subjects factor), p < 0.0069; genotype × sex interaction, p = 0.20]. n = 11 littermate pairs. Data represent means ± SEM.
Figure 2.
Figure 2.
NL1 KO mice exhibit minimal social behavior abnormalities. A, NL1 WT and KO mice were allowed to interact sequentially with a novel inanimate target (i.e., an empty cage) and a social target (i.e., a caged adult conspecific mouse) in an open field. An initial three-way mixed ANOVA found a significant main effect of genotype [three-way mixed ANOVA, genotype (between-subjects factor), p < 0.04; sex (between-subjects factor), p = 0.97; target (within-subjects factor), p = 0.76; genotype × sex interaction, p = 0.29; genotype × target interaction, p = 0.38; sex × target interaction, p = 0.38; genotype × sex × target interaction, p = 0.59]. Additional planned comparisons found that NL1 WT mice spent less time interacting with the social target than controls (left bars, *p < 0.04, planned comparisons). Both NL1 WT and KO mice spent similar amounts of time interacting with the novel, inanimate target (right bars, p = 0.13, planned comparisons). n = 23 littermate pairs. Legend in A applies to A–E. B, Time spent in interactions using the social versus inanimate preference test. Mice were simultaneously exposed to a novel inanimate target (i.e., an empty cage) and a novel social target (i.e., a novel, caged adult conspecific mouse). The time spent interacting with inanimate and social targets was not different between NL1 KO mice and controls, and neither WT or NL1 KO mice preferred the social target over the inanimate target [three-way mixed ANOVA, genotype (between-subjects factor), p = 0.22; sex (between-subjects factor), p = 0.16; target (within-subjects factor), p = 0.08; genotype × sex interaction, p = 0.27; genotype × target interaction, p = 0.97; genotype × sex × target interaction, p = 0.81]. ns, Not significant. n = 23 littermate pairs. C, Time spent in interactions using the social novelty preference test. Mice were simultaneously exposed to a novel social target (i.e., a novel, caged adult conspecific mouse) and a familiar social target (i.e., a familiar, caged adult conspecific mouse). A three-way mixed ANOVA found a main effect of target [three-way mixed ANOVA, genotype (between-subjects factor), p = 0.39; sex (between-subjects factor), p = 0.50; target (within-subjects factor), p < 0.003; genotype × sex interaction, p = 0.31; genotype × target interaction, p = 0.40; sex × target interaction, p = 0.87; genotype × sex × target interaction, p = 0.46]. However, planned comparisons within each genotype found that, unlike WT mice, NL1 KO mice did not exhibit a preference for the novel social target (**p < 0.006; ns, not significant; p = 0.10, planned comparisons). n = 23 littermate pairs. D, Time spent interacting with a freely moving juvenile mouse during a test of social learning [three-way mixed ANOVA, genotype (between-subjects factor), p = 0.39; sex (between-subjects factor), p < 0.041; trial (within-subjects factor), p < 0.0007; genotype × sex interaction, p = 0.56; genotype × trial interaction, p = 0.78; sex × trial interaction, p = 0.07; genotype × sex × trial interaction, p = 0.23]. Mice were initially allowed to interact with a juvenile target mouse for 2 min (Day 1), and NL1 KO mice showed normal direct social interaction with the juvenile. Seventy-two hours later (Day 4), mice were again allowed to interact with the same juvenile target mouse, and both WT and NL1 KO mice exhibited significant social learning (recognition memory), as indicated by a decrease in the amount of time spent interacting with the juvenile (*p < 0.021 for WT; p < 0.008 for KO, planned comparisons within each genotype). n = 23 littermate pairs. E, The thickness (i.e., the height) of nests built from cotton nesting material was measured over a 90 min observation period [three-way mixed ANOVA, genotype (between-subjects factor), p < 0.044; sex (between-subjects factor), p = 0.35; time (within-subjects factor), p < 0.000013; genotype × sex interaction, p = 0.69; genotype × time interaction, p = 0.15; sex × time interaction, p = 0.18; genotype × sex × time interaction, p < 0.032]. WT mice built thicker nests than NL1 KO mice (*p < 0.021, planned comparison between genotypes at 90 min). n = 11 littermate pairs. Data represent means ± SEM.
Figure 3.
Figure 3.
NL1 KO mice exhibit impaired spatial memory in the Morris water maze. A–D, Training trials for the Morris water maze task. For each day of training, data were averaged across the four daily trials, and, in all three-way mixed ANOVAs, “day” was treated as the repeated measure. NL1 KO mice displayed an abnormal learning curve as measured by distance to reach the submerged platform compared with WT (A) [three-way mixed ANOVA, genotype (between-subjects factor), p < 0.0089; sex (between-subjects factor), p = 0.61; day (within-subjects factor), p < 0.000001; genotype × sex interaction, p = 0.92; genotype × day interaction, p = 0.65; sex × day interaction, p = 0.50; genotype × sex × day interaction, p = 0.89]. The latency to reach the platform (B) was normal in the NL1 KO mice [three-way mixed ANOVA, genotype (between-subjects factor), p = 0.47; sex (between-subjects factor), p = 0.65; day (within-subjects factor), p < 0.000001; genotype × sex interaction, p = 0.74; genotype × day interaction, p = 0.93; sex × day interaction, p = 0.11; genotype × sex × day interaction, p = 0.50]. NL1 KO mice exhibited faster average swim speeds (C) than controls [three-way mixed ANOVA, genotype (between-subjects factor), F(1,42) = 4.59, p < 0.038; sex (between-subjects factor), p = 0.14; day (within-subjects factor), p < 0.000001; genotype × sex interaction, p = 0.94; genotype × day interaction, p = 0.88; sex × day interaction, p = 0.89; genotype × sex × day interaction, p = 0.82]. Percentage time spent near the wall of the maze (D, percentage thigmotaxis) was not different across groups [three-way mixed ANOVA, genotype (between-subjects factor), p = 0.95; sex (between-subjects factor), p = 0.82; day (within-subjects factor), p < 0.000001; genotype × sex interaction, p = 0.99; genotype × day interaction, p = 0.60; sex × day interaction, p = 0.78; genotype × sex × day interaction, p = 0.96]. There were no differences between groups in the visible platform task (supplemental Fig. 2, available at www.jneurosci.org as supplemental material). n = 23 littermate pairs. Legend in A also applies to B–D. E, Percentage of time that mice spent swimming in each quadrant of the pool during the probe trial (i.e., spatial memory test) on day 12 of the Morris water maze [three-way mixed ANOVA, sex (between-subjects factor), p = 0.22; genotype (between-subjects factor), p = 0.84; quadrant (within-subjects factor), p < 0.000001; sex × genotype interaction, p = 0.84; sex × quadrant interaction, p = 0.53; genotype × quadrant interaction, p < 0.02; sex × genotype × quadrant interaction, p = 0.96]. NL1 KO mice spent less time in the target quadrant than controls (*p < 0.037 for NL1 KO target vs WT target, planned comparisons) and, unlike control mice (#p < 0.05 compared with all other quadrants, planned comparisons) showed no preference for the target quadrant, indicating a deficit in spatial memory. n = 23 littermate pairs. Data represent means ± SEM.
Figure 4.
Figure 4.
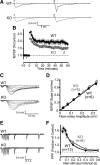
Decreased theta burst-induced LTP in area CA1 of NL1 KO mice. A, Representative traces showing fEPSPs from a WT and a KO animal before (1) and after (2) LTP induction by TBS. B, Time course of fEPSPs before and after LTP induction by TBS in WT (n = 6) and KO (n = 6) animals. The time points of the representative traces in A are noted on the graph (see 1 and 2). C, AMPA-mediated synaptic strength is unchanged in NL1 KO mice. Representative traces from a WT and a KO animal show input–output measurements with increasing stimulus intensities. Responses were measured in area CA1 of mouse hippocampus. D, Average fEPSP slope plotted against fiber-volley amplitude. Input–output measurements were performed in wild-type (n = 6) and KO (n = 5) animals. E, Overlaid representative traces from a WT and a KO animal showing paired-pulse facilitation of excitatory synaptic responses at interstimulus intervals ranging from 30 to 600 ms. F, Average paired-pulse facilitation of excitatory synaptic responses did not show any difference between WT (n = 12) and KO (n = 8) animals. Data plotted as means ± SEM.
Figure 5.
Figure 5.
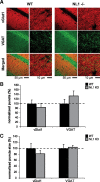
Number and size of glutamatergic and GABAergic synapses are normal in NL1-deficient CA1 region of hippocampus. A, Representative confocal images of wild-type and NL1 KO CA1 region of hippocampus double immunostained for VGLUT1 and VGAT. Number (B) and size (C) of both VGLUT1- and VGAT-positive puncta are normal in NL1 KO neurons. y-axis depicts normalized number (B) and size (C) with wild-type control. n = 3 mice per genotype.
Figure 6.
Figure 6.
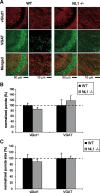
Number and size of glutamatergic and GABAergic synapses are normal in NL1-deficient CA3 region of hippocampus. A, Representative confocal images of wild-type and NL1 KO CA3 region of hippocampus double immunostained for VGLUT1 and VGAT. B, C, Number (B) and size (C) of both VGLUT1- and VGAT-positive puncta are normal in NL1 KO neurons. y-axis depicts normalized number (B) and size (C) with wild-type control. n = 3 mice per genotype.
Figure 7.
Figure 7.
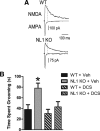
NL1 KO mice exhibit a decreased NMDA/AMPA ratio in the dorsal striatum accompanied by increased repetitive behavior that can be rescued pharmacologically. A, NMDAR- and AMPAR-mediated responses are indicated in wild-type traces. Current amplitude was normalized to that of the AMPAR peak. Amplitude of NMDAR currents at +40 mV was measured in a 2 ms window set at 50 ms from spike onset (dashed line on traces). B, The time spent grooming was observed 30 min after systemic administration of the NMDA partial coagonist DCS (20 mg/kg). Administration of DCS rescued the increased grooming phenotype in NL1 KO mice [*p < 0.02 compared with all other groups, post hoc Tukey's honestly significant difference test; three-way ANOVA, sex (between-subjects factor), p = 0.45; genotype (between-subjects factor), p < 0.004; treatment (between-subjects factor), p < 0.02; sex × genotype interaction, p = 0.48; sex × treatment, p = 0.54; genotype × treatment interaction, p = 0.09; sex × genotype × treatment interaction, p = 0.36]. Vehicle (Veh), n = 20 littermate pairs; DCS, n = 19 littermate pairs. Data represent means ± SEM.

Similar articles

Cited by

References

    1. Aldridge JW, Berridge KC, Rosen AR. Basal ganglia neural mechanisms of natural movement sequences. Can J Physiol Pharmacol. 2004;82:732–739. - PubMed
    1. American Psychiatric Association. Diagnostic and statistical manual of mental disorders DSM-IV-TR. Washington, DC: American Psychiatric Association; 2000.
    1. Berton O, McClung CA, Dileone RJ, Krishnan V, Renthal W, Russo SJ, Graham D, Tsankova NM, Bolanos CA, Rios M, Monteggia LM, Self DW, Nestler EJ. Essential role of BDNF in the mesolimbic dopamine pathway in social defeat stress. Science. 2006;311:864–868. - PubMed
    1. Bienvenu OJ, Wang Y, Shugart YY, Welch JM, Grados MA, Fyer AJ, Rauch SL, McCracken JT, Rasmussen SA, Murphy DL, Cullen B, Valle D, Hoehn-Saric R, Greenberg BD, Pinto A, Knowles JA, Piacentini J, Pauls DL, Liang KY, Willour VL, et al. Sapap3 and pathological grooming in humans: Results from the OCD collaborative genetics study. Am J Med Genet B Neuropsychiatr Genet. 2009;150B:710–720. - PMC - PubMed
    1. Borsini F, Podhorna J, Marazziti D. Do animal models of anxiety predict anxiolytic-like effects of antidepressants? Psychopharmacology (Berl) 2002;163:121–141. - PubMed

Publication types

MeSH terms