Dynamic regulation of functionally distinct virus-specific T cells
- PMID: 20133680
- PMCID: PMC2840453
- DOI: 10.1073/pnas.0915168107
Dynamic regulation of functionally distinct virus-specific T cells
Abstract
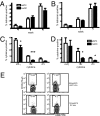
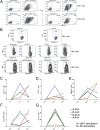
The functional capacities of CD8(+) T cells important for virus clearance are influenced by interactions with antigen presenting cells (APCs) and CD4(+) T cells during initial selection, subsequent expansion, and development of memory. Recently, investigators have shown that polyfunctional T cells correlate best with long-term protection, however, it is still unknown how to stimulate T cells to achieve these responses. To study this, we examined the phenotypes and functions of CD8(+) T cells specific for two different virus antigens stimulated ex vivo using either autologous monocyte-derived dendritic cells (moDCs) or HLA-A2-Ig-based artificial APCs (aAPCs). Although similar numbers of influenza virus and measles virus tetramer-positive cells were generated by stimulation with peptide-loaded moDCs and aAPCs, T cell function, assessed by expression of IL-2, IFN-gamma, TNF-alpha, MIP1beta, and CD107a, showed that aAPC-generated CD8(+) T cells were multifunctional, whereas moDC-generated cells were mostly monofunctional. aAPC-generated cells also produced more of each cytokine per cell than CD8(+) T cells generated with moDCs. These phenotypes were not fixed, as changing the culture conditions of expanding T cells from aAPCs to moDCs, and moDCs to aAPCs, reversed the phenotypes. We conclude that CD8(+) T cells are heterogeneous in their functionality and that this is dependent, in a dynamic way, on the stimulating APC. These studies will lead to understanding the factors that influence induction of optimal CD8(+) T cell function.
Conflict of interest statement
The authors declare no conflict of interest.
Figures


Similar articles
-
A panel of artificial APCs expressing prevalent HLA alleles permits generation of cytotoxic T cells specific for both dominant and subdominant viral epitopes for adoptive therapy.J Immunol. 2009 Aug 15;183(4):2837-50. doi: 10.4049/jimmunol.0804178. Epub 2009 Jul 27. J Immunol. 2009. PMID: 19635907 Free PMC article.
-
Functional supertype of HLA-A2 in the presentation of Flu matrix p58-66 to induce CD8+ T-cell response in a Northern Chinese population.Tissue Antigens. 2003 Oct;62(4):285-95. doi: 10.1034/j.1399-0039.2003.00102.x. Tissue Antigens. 2003. PMID: 12974795
-
Dendritic cells containing apoptotic melanoma cells prime human CD8+ T cells for efficient tumor cell lysis.Cancer Res. 2000 Aug 15;60(16):4446-52. Cancer Res. 2000. PMID: 10969791
-
A comparison of gene transfer and antigen-loaded dendritic cells for the generation of CD4+ and CD8+ cytomegalovirus-specific T cells in HLA-A2+ and HLA-A2- donors.Biol Blood Marrow Transplant. 2004 Nov;10(11):761-71. doi: 10.1016/j.bbmt.2004.05.011. Biol Blood Marrow Transplant. 2004. PMID: 15505607
-
Severity of Acute Infectious Mononucleosis Correlates with Cross-Reactive Influenza CD8 T-Cell Receptor Repertoires.mBio. 2017 Dec 5;8(6):e01841-17. doi: 10.1128/mBio.01841-17. mBio. 2017. PMID: 29208744 Free PMC article.
Cited by
-
Polyfunctional T cells accumulate in large human cytomegalovirus-specific T cell responses.J Virol. 2012 Jan;86(2):1001-9. doi: 10.1128/JVI.00873-11. Epub 2011 Nov 9. J Virol. 2012. PMID: 22072753 Free PMC article.
-
A high-throughput single-cell analysis of human CD8⁺ T cell functions reveals discordance for cytokine secretion and cytolysis.J Clin Invest. 2011 Nov;121(11):4322-31. doi: 10.1172/JCI58653. Epub 2011 Oct 3. J Clin Invest. 2011. PMID: 21965332 Free PMC article.
-
Human leukocyte antigens A*3001 and A*3002 show distinct peptide-binding patterns of the Mycobacterium tuberculosis protein TB10.4: consequences for immune recognition.Clin Vaccine Immunol. 2011 Jan;18(1):125-34. doi: 10.1128/CVI.00302-10. Epub 2010 Nov 17. Clin Vaccine Immunol. 2011. PMID: 21084459 Free PMC article.
-
Live-attenuated bivalent measles virus-derived vaccines targeting Middle East respiratory syndrome coronavirus induce robust and multifunctional T cell responses against both viruses in an appropriate mouse model.Virology. 2018 Aug;521:99-107. doi: 10.1016/j.virol.2018.05.028. Epub 2018 Jun 11. Virology. 2018. PMID: 29902727 Free PMC article.
-
CD47 Enhances In Vivo Functionality of Artificial Antigen-Presenting Cells.Clin Cancer Res. 2015 May 1;21(9):2075-83. doi: 10.1158/1078-0432.CCR-14-2696. Epub 2015 Jan 15. Clin Cancer Res. 2015. PMID: 25593301 Free PMC article.
References
-
- Topham DJ, Tripp RA, Doherty PC. CD8+ T cells clear influenza virus by perforin or Fas-dependent processes. J Immunol. 1997;159:5197–5200. - PubMed
-
- Moskophidis D, Cobbold SP, Waldmann H, Lehmann-Grube F. Mechanism of recovery from acute virus infection: Treatment of lymphocytic choriomeningitis virus-infected mice with monoclonal antibodies reveals that Lyt-2+ T lymphocytes mediate clearance of virus and regulate the antiviral antibody response. J Virol. 1987;61:1867–1874. - PMC - PubMed
Publication types
MeSH terms
Substances
Grants and funding
LinkOut - more resources
Full Text Sources
Other Literature Sources
Molecular Biology Databases
Research Materials
Miscellaneous

