

Cell type specificity of chromatin organization mediated by CTCF and cohesin
- PMID: 20133600
- PMCID: PMC2840441
- DOI: 10.1073/pnas.0912087107
Cell type specificity of chromatin organization mediated by CTCF and cohesin
Abstract
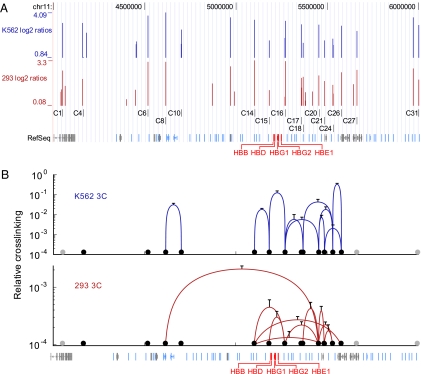
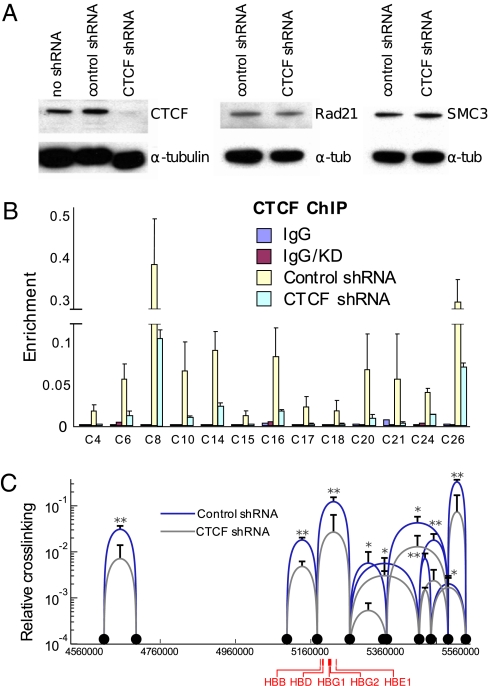
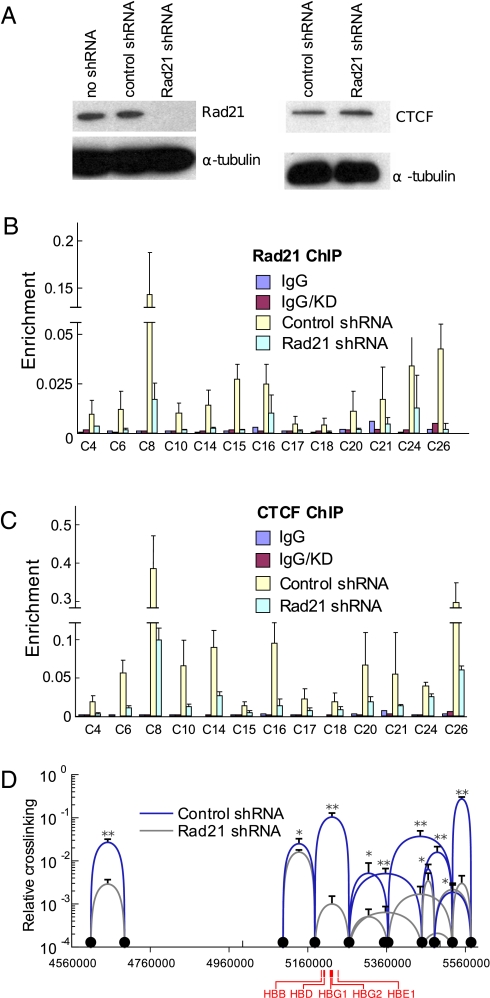
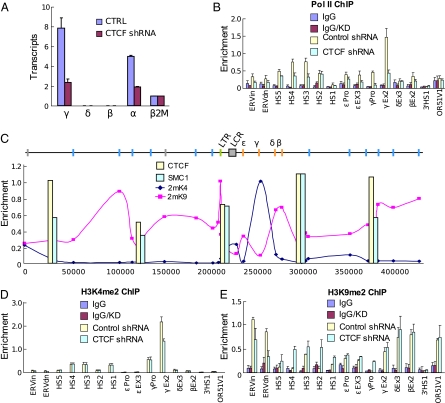
CTCF sites are abundant in the genomes of diverse species but their function is enigmatic. We used chromosome conformation capture to determine long-range interactions among CTCF/cohesin sites over 2 Mb on human chromosome 11 encompassing the beta-globin locus and flanking olfactory receptor genes. Although CTCF occupies these sites in both erythroid K562 cells and fibroblast 293T cells, the long-range interaction frequencies among the sites are highly cell type specific, revealing a more densely clustered organization in the absence of globin gene activity. Both CTCF and cohesins are required for the cell-type-specific chromatin conformation. Furthermore, loss of the organizational loops in K562 cells through reduction of CTCF with shRNA results in acquisition of repressive histone marks in the globin locus and reduces globin gene expression whereas silent flanking olfactory receptor genes are unaffected. These results support a genome-wide role for CTCF/cohesin sites through loop formation that both influences transcription and contributes to cell-type-specific chromatin organization and function.
Conflict of interest statement
The authors declare no conflict of interest.
Figures
Similar articles
-
Cohesin mediates chromatin interactions that regulate mammalian β-globin expression.J Biol Chem. 2011 May 20;286(20):17870-8. doi: 10.1074/jbc.M110.207365. Epub 2011 Mar 29. J Biol Chem. 2011. PMID: 21454523 Free PMC article.
-
CTCF-mediated transcriptional regulation through cell type-specific chromosome organization in the β-globin locus.Nucleic Acids Res. 2012 Sep;40(16):7718-27. doi: 10.1093/nar/gks536. Epub 2012 Jun 16. Nucleic Acids Res. 2012. PMID: 22705794 Free PMC article.
-
Tissue-specific CTCF-cohesin-mediated chromatin architecture delimits enhancer interactions and function in vivo.Nat Cell Biol. 2017 Aug;19(8):952-961. doi: 10.1038/ncb3573. Epub 2017 Jul 24. Nat Cell Biol. 2017. PMID: 28737770 Free PMC article.
-
CTCF: the protein, the binding partners, the binding sites and their chromatin loops.Philos Trans R Soc Lond B Biol Sci. 2013 May 6;368(1620):20120369. doi: 10.1098/rstb.2012.0369. Print 2013. Philos Trans R Soc Lond B Biol Sci. 2013. PMID: 23650640 Free PMC article. Review.
-
Genome-wide studies of CCCTC-binding factor (CTCF) and cohesin provide insight into chromatin structure and regulation.J Biol Chem. 2012 Sep 7;287(37):30906-13. doi: 10.1074/jbc.R111.324962. Epub 2012 Sep 5. J Biol Chem. 2012. PMID: 22952237 Free PMC article. Review.
Cited by
-
Chromatin loops, gene positioning, and gene expression.Front Genet. 2012 Oct 17;3:217. doi: 10.3389/fgene.2012.00217. eCollection 2012. Front Genet. 2012. PMID: 23087710 Free PMC article.
-
The Chromatin Signature of Pluripotency: Establishment and Maintenance.Curr Stem Cell Rep. 2016;2(3):255-262. doi: 10.1007/s40778-016-0055-3. Epub 2016 Jun 27. Curr Stem Cell Rep. 2016. PMID: 27547710 Free PMC article. Review.
-
Chromatin architecture, CCCTC-binding factor, and V(D)J recombination: managing long-distance relationships at antigen receptor loci.J Immunol. 2013 May 15;190(10):4915-21. doi: 10.4049/jimmunol.1300218. J Immunol. 2013. PMID: 23645930 Free PMC article. Review.
-
Targeting CTCF to Control Virus Gene Expression: A Common Theme amongst Diverse DNA Viruses.Viruses. 2015 Jul 6;7(7):3574-85. doi: 10.3390/v7072791. Viruses. 2015. PMID: 26154016 Free PMC article. Review.
-
Revealing transcription factor and histone modification co-localization and dynamics across cell lines by integrating ChIP-seq and RNA-seq data.BMC Genomics. 2018 Dec 31;19(Suppl 10):914. doi: 10.1186/s12864-018-5278-5. BMC Genomics. 2018. PMID: 30598100 Free PMC article.
References
Publication types
MeSH terms
Substances
Grants and funding
LinkOut - more resources
Full Text Sources
Other Literature Sources
Molecular Biology Databases
Miscellaneous
