

Identification of endogenous control genes for normalisation of real-time quantitative PCR data in colorectal cancer
- PMID: 20122155
- PMCID: PMC2825202
- DOI: 10.1186/1471-2199-11-12
Identification of endogenous control genes for normalisation of real-time quantitative PCR data in colorectal cancer
Abstract
Background: Gene expression analysis has many applications in cancer diagnosis, prognosis and therapeutic care. Relative quantification is the most widely adopted approach whereby quantification of gene expression is normalised relative to an endogenously expressed control (EC) gene. Central to the reliable determination of gene expression is the choice of control gene. The purpose of this study was to evaluate a panel of candidate EC genes from which to identify the most stably expressed gene(s) to normalise RQ-PCR data derived from primary colorectal cancer tissue.
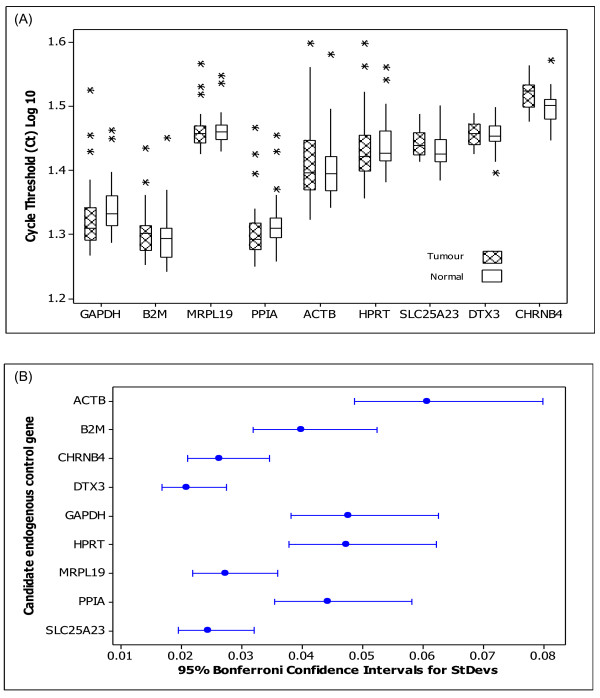
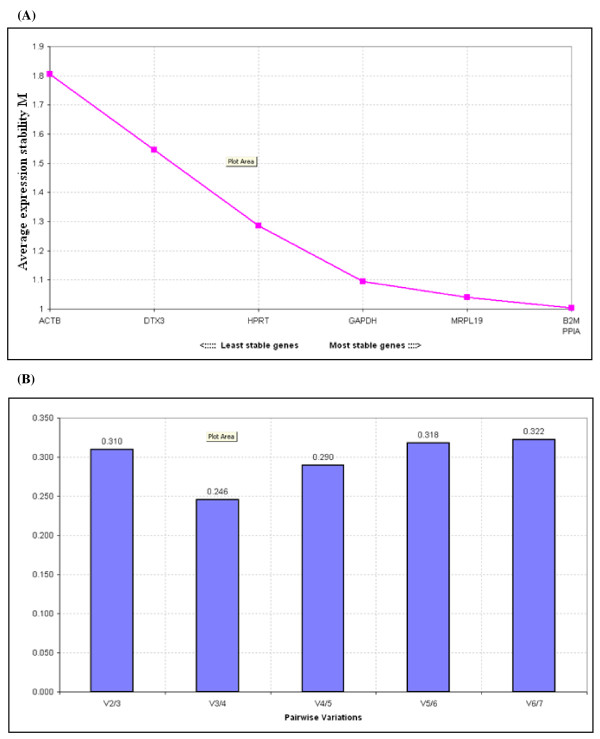
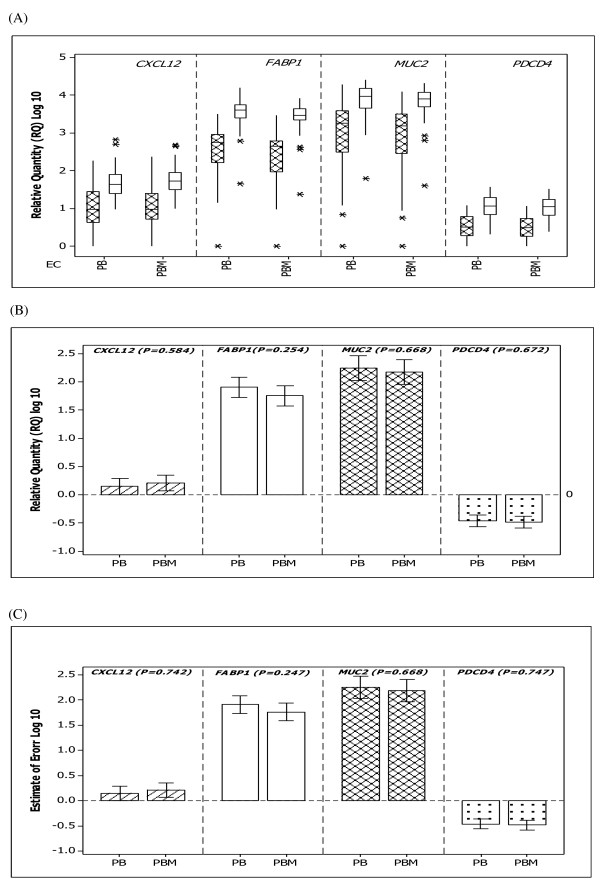
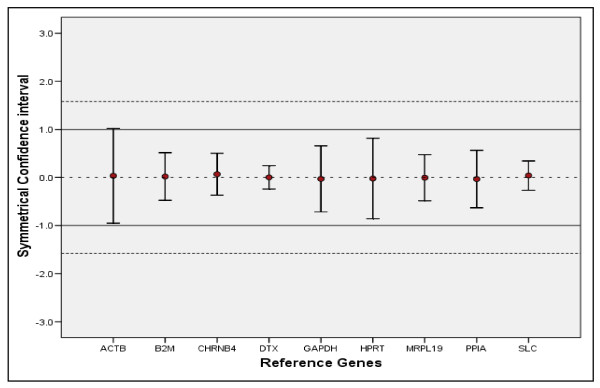
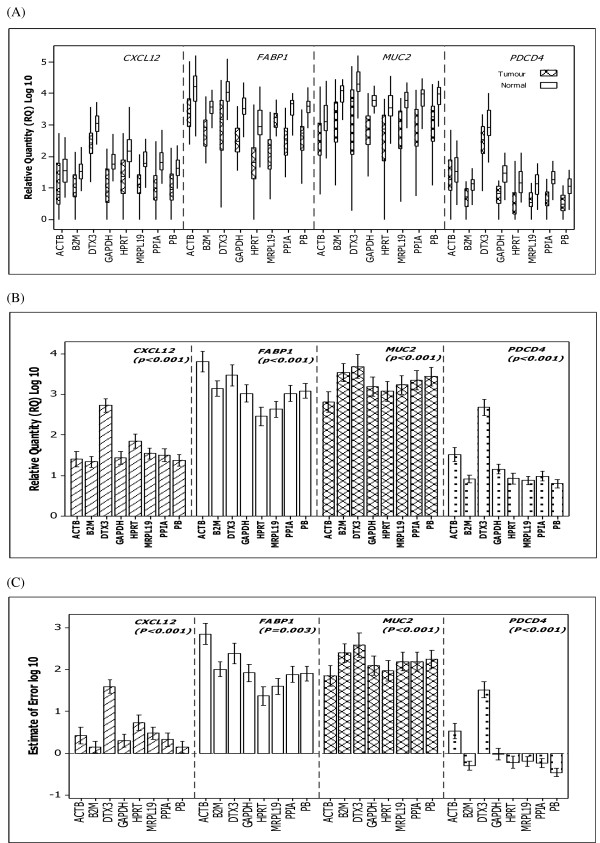
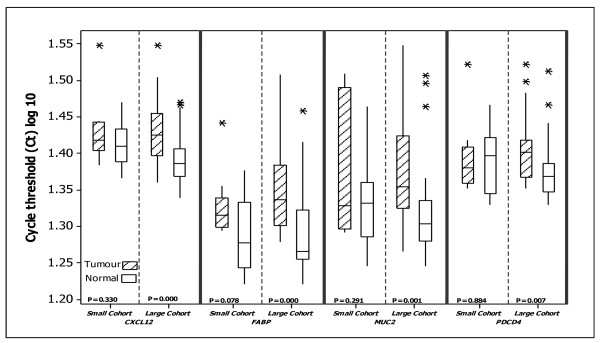
Results: The expression of thirteen candidate EC genes: B2M, HPRT, GAPDH, ACTB, PPIA, HCRT, SLC25A23, DTX3, APOC4, RTDR1, KRTAP12-3, CHRNB4 and MRPL19 were analysed in a cohort of 64 colorectal tumours and tumour associated normal specimens. CXCL12, FABP1, MUC2 and PDCD4 genes were chosen as target genes against which a comparison of the effect of each EC gene on gene expression could be determined. Data analysis using descriptive statistics, geNorm, NormFinder and qBasePlus indicated significant difference in variances between candidate EC genes. We determined that two genes were required for optimal normalisation and identified B2M and PPIA as the most stably expressed and reliable EC genes.
Conclusion: This study identified that the combination of two EC genes (B2M and PPIA) more accurately normalised RQ-PCR data in colorectal tissue. Although these control genes might not be optimal for use in other cancer studies, the approach described herein could serve as a template for the identification of valid ECs in other cancer types.
Figures
Similar articles
-
Evaluation and validation of candidate endogenous control genes for real-time quantitative PCR studies of breast cancer.BMC Mol Biol. 2007 Nov 27;8:107. doi: 10.1186/1471-2199-8-107. BMC Mol Biol. 2007. PMID: 18042273 Free PMC article.
-
Reference genes for quantitative RT-PCR data in gastric tissues and cell lines.World J Gastroenterol. 2013 Nov 7;19(41):7121-8. doi: 10.3748/wjg.v19.i41.7121. World J Gastroenterol. 2013. PMID: 24222956 Free PMC article.
-
Whole blood ACTB, B2M and GAPDH expression reflects activity of inflammatory bowel disease, advancement of colorectal cancer, and correlates with circulating inflammatory and angiogenic factors: Relevance for real-time quantitative PCR.Adv Clin Exp Med. 2020 May;29(5):547-556. doi: 10.17219/acem/118845. Adv Clin Exp Med. 2020. PMID: 32424999
-
Identification of valid endogenous control genes for determining gene expression in C6 glioma cell line treated with conditioned medium from adipose-derived stem cell.Biomed Pharmacother. 2015 Oct;75:75-82. doi: 10.1016/j.biopha.2015.08.035. Epub 2015 Sep 7. Biomed Pharmacother. 2015. PMID: 26463634 Review.
-
Critical appraisal of quantitative PCR results in colorectal cancer research: can we rely on published qPCR results?Mol Oncol. 2014 Jun;8(4):813-8. doi: 10.1016/j.molonc.2013.12.016. Epub 2014 Jan 2. Mol Oncol. 2014. PMID: 24423493 Free PMC article. Review.
Cited by
-
Evidence-based selection of reference genes for RT-qPCR assays in periodontal research.Clin Exp Dent Res. 2022 Apr;8(2):473-484. doi: 10.1002/cre2.525. Epub 2022 Feb 1. Clin Exp Dent Res. 2022. PMID: 35106960 Free PMC article.
-
Identification of miR-23a as a novel microRNA normalizer for relative quantification in human uterine cervical tissues.Exp Mol Med. 2011 Jun 30;43(6):358-66. doi: 10.3858/emm.2011.43.6.039. Exp Mol Med. 2011. PMID: 21519184 Free PMC article.
-
A pan-cancer analysis of the prognostic and immunological role of β-actin (ACTB) in human cancers.Bioengineered. 2021 Dec;12(1):6166-6185. doi: 10.1080/21655979.2021.1973220. Bioengineered. 2021. PMID: 34486492 Free PMC article.
-
Evaluation of reference genes at different developmental stages for quantitative real-time PCR in Aedes aegypti.Sci Rep. 2017 Mar 16;7:43618. doi: 10.1038/srep43618. Sci Rep. 2017. PMID: 28300076 Free PMC article.
-
GAPDH and PUM1: Optimal Housekeeping Genes for Quantitative Polymerase Chain Reaction-Based Analysis of Cancer Stem Cells and Epithelial-Mesenchymal Transition Gene Expression in Rectal Tumors.Cureus. 2020 Dec 10;12(12):e12020. doi: 10.7759/cureus.12020. Cureus. 2020. PMID: 33457124 Free PMC article.
References
-
- O'Connell JB, Maggard MA, Ko CY. Colon cancer survival rates with the new American Joint Committee on Cancer sixth edition staging. J Natl Cancer Inst. 2004;96(19):1420–1425. - PubMed
-
- de Kok JB, Roelofs RW, Giesendorf BA, Pennings JL, Waas ET, Feuth T, Swinkels DW, Span PN. Normalization of gene expression measurements in tumor tissues: comparison of 13 endogenous control genes. Lab Invest. 2005;85(1):154–159. - PubMed
-
- Dydensborg AB, Herring E, Auclair J, Tremblay E, Beaulieu JF. Normalizing genes for quantitative RT-PCR in differentiating human intestinal epithelial cells and adenocarcinomas of the colon. Am J Physiol Gastrointest Liver Physiol. 2006;290(5):1067–1074. doi: 10.1152/ajpgi.00234.2005. - DOI - PubMed
Publication types
MeSH terms
Substances
LinkOut - more resources
Full Text Sources
Medical
Research Materials
Miscellaneous
