

Improving small-angle X-ray scattering data for structural analyses of the RNA world
- PMID: 20106957
- PMCID: PMC2822928
- DOI: 10.1261/rna.1946310
Improving small-angle X-ray scattering data for structural analyses of the RNA world
Abstract
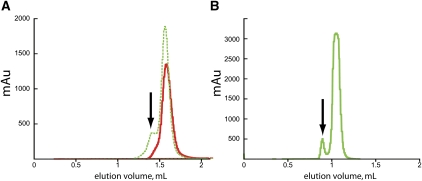
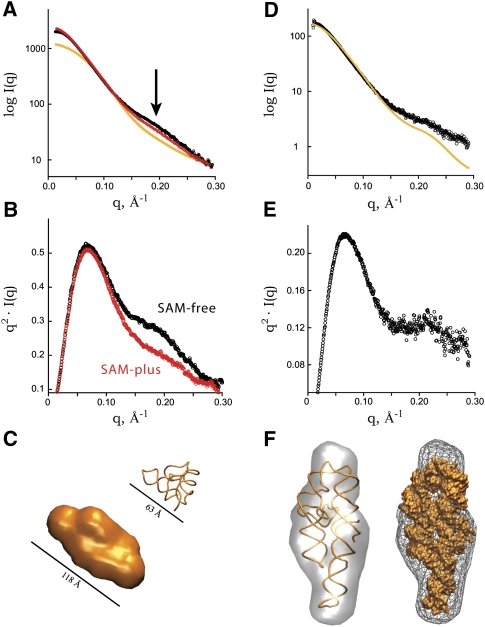
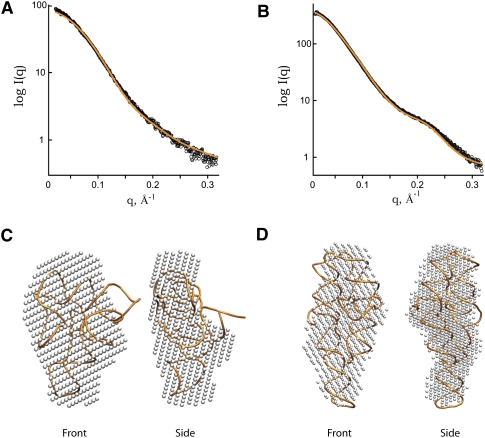
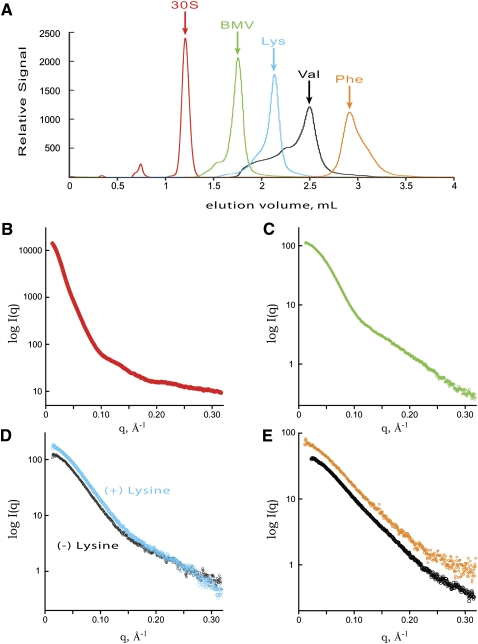
Defining the shape, conformation, or assembly state of an RNA in solution often requires multiple investigative tools ranging from nucleotide analog interference mapping to X-ray crystallography. A key addition to this toolbox is small-angle X-ray scattering (SAXS). SAXS provides direct structural information regarding the size, shape, and flexibility of the particle in solution and has proven powerful for analyses of RNA structures with minimal requirements for sample concentration and volumes. In principle, SAXS can provide reliable data on small and large RNA molecules. In practice, SAXS investigations of RNA samples can show inconsistencies that suggest limitations in the SAXS experimental analyses or problems with the samples. Here, we show through investigations on the SAM-I riboswitch, the Group I intron P4-P6 domain, 30S ribosomal subunit from Sulfolobus solfataricus (30S), brome mosaic virus tRNA-like structure (BMV TLS), Thermotoga maritima asd lysine riboswitch, the recombinant tRNA(val), and yeast tRNA(phe) that many problems with SAXS experiments on RNA samples derive from heterogeneity of the folded RNA. Furthermore, we propose and test a general approach to reducing these sample limitations for accurate SAXS analyses of RNA. Together our method and results show that SAXS with synchrotron radiation has great potential to provide accurate RNA shapes, conformations, and assembly states in solution that inform RNA biological functions in fundamental ways.
Figures
Similar articles
-
Methods for using new conceptual tools and parameters to assess RNA structure by small-angle X-ray scattering.Methods Enzymol. 2014;549:235-63. doi: 10.1016/B978-0-12-801122-5.00011-8. Methods Enzymol. 2014. PMID: 25432752
-
RNA structure determination using SAXS data.J Phys Chem B. 2010 Aug 12;114(31):10039-48. doi: 10.1021/jp1057308. J Phys Chem B. 2010. PMID: 20684627 Free PMC article.
-
Bridging the solution divide: comprehensive structural analyses of dynamic RNA, DNA, and protein assemblies by small-angle X-ray scattering.Curr Opin Struct Biol. 2010 Feb;20(1):128-37. doi: 10.1016/j.sbi.2009.12.015. Epub 2010 Jan 22. Curr Opin Struct Biol. 2010. PMID: 20097063 Free PMC article. Review.
-
Structural Analysis of RNA by Small-Angle X-ray Scattering.Methods Mol Biol. 2020;2113:189-215. doi: 10.1007/978-1-0716-0278-2_14. Methods Mol Biol. 2020. PMID: 32006316
-
A practical guide to small angle X-ray scattering (SAXS) of flexible and intrinsically disordered proteins.FEBS Lett. 2015 Sep 14;589(19 Pt A):2570-7. doi: 10.1016/j.febslet.2015.08.027. Epub 2015 Aug 29. FEBS Lett. 2015. PMID: 26320411 Review.
Cited by
-
Multiple conformations of SAM-II riboswitch detected with SAXS and NMR spectroscopy.Nucleic Acids Res. 2012 Apr;40(7):3117-30. doi: 10.1093/nar/gkr1154. Epub 2011 Dec 1. Nucleic Acids Res. 2012. PMID: 22139931 Free PMC article.
-
Small-angle X-ray scattering: a bridge between RNA secondary structures and three-dimensional topological structures.Curr Opin Struct Biol. 2015 Feb;30:147-160. doi: 10.1016/j.sbi.2015.02.010. Epub 2015 Mar 10. Curr Opin Struct Biol. 2015. PMID: 25765781 Free PMC article. Review.
-
Validation of macromolecular flexibility in solution by small-angle X-ray scattering (SAXS).Eur Biophys J. 2012 Oct;41(10):789-99. doi: 10.1007/s00249-012-0820-x. Epub 2012 May 26. Eur Biophys J. 2012. PMID: 22639100 Free PMC article. Review.
-
Accurate SAXS profile computation and its assessment by contrast variation experiments.Biophys J. 2013 Aug 20;105(4):962-74. doi: 10.1016/j.bpj.2013.07.020. Biophys J. 2013. PMID: 23972848 Free PMC article.
-
Considerations for Sample Preparation Using Size-Exclusion Chromatography for Home and Synchrotron Sources.Adv Exp Med Biol. 2017;1009:31-45. doi: 10.1007/978-981-10-6038-0_3. Adv Exp Med Biol. 2017. PMID: 29218552 Free PMC article.
References
-
- Badorrek CS, Weeks KM. Architecture of a γ retroviral genomic RNA dimer. Biochemistry. 2006;45:12664–12672. - PubMed
-
- Carter AP, Clemons WM, Brodersen DE, Morgan-Warren RJ, Wimberly BT, Ramakrishnan V. Functional insights from the structure of the 30S ribosomal subunit and its interactions with antibiotics. Nature. 2000;407:340–348. - PubMed
-
- Chen L, Hodgson KO, Doniach S. A lysozyme folding intermediate revealed by solution X-ray scattering. J Mol Biol. 1996;261:658–671. - PubMed
-
- Doniach S. Changes in biomolecular conformation seen by small-angle X-ray scattering. Chem Rev. 2001;101:1763–1778. - PubMed
Publication types
MeSH terms
Substances
LinkOut - more resources
Full Text Sources
Other Literature Sources
Molecular Biology Databases
Research Materials