

C-C chemokine receptor 2 (CCR2) regulates the hepatic recruitment of myeloid cells that promote obesity-induced hepatic steatosis
- PMID: 20103702
- PMCID: PMC2844839
- DOI: 10.2337/db09-1403
C-C chemokine receptor 2 (CCR2) regulates the hepatic recruitment of myeloid cells that promote obesity-induced hepatic steatosis
Abstract
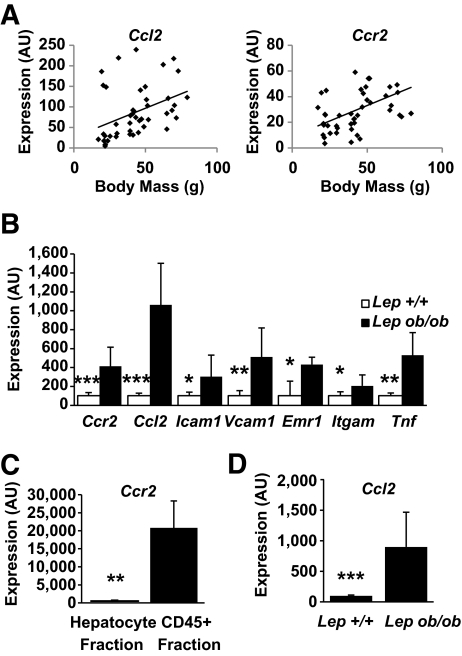
Objective: Obesity induces a program of systemic inflammation that is implicated in the development of many of its clinical sequelae. Hepatic inflammation is a feature of obesity-induced liver disease, and our previous studies demonstrated reduced hepatic steatosis in obese mice deficient in the C-C chemokine receptor 2 (CCR2) that regulates myeloid cell recruitment. This suggests that a myeloid cell population is recruited to the liver in obesity and contributes to nonalcoholic fatty liver disease.
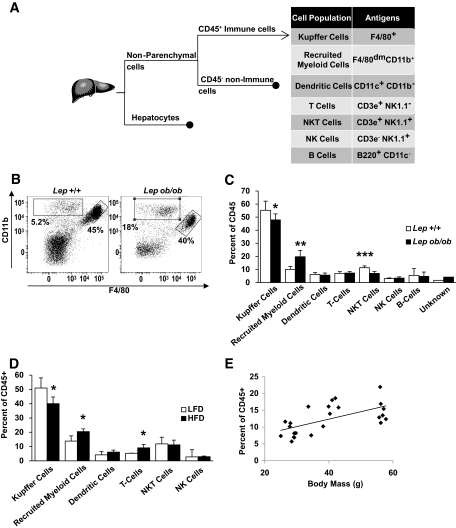
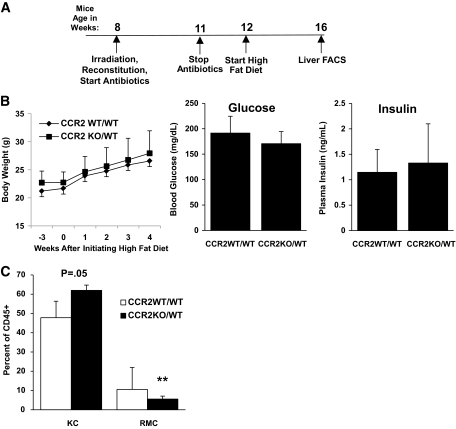
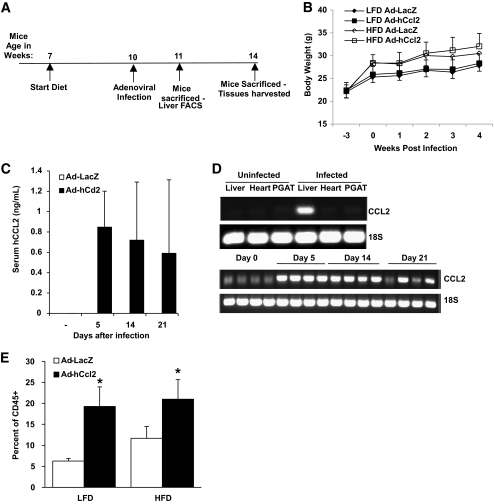
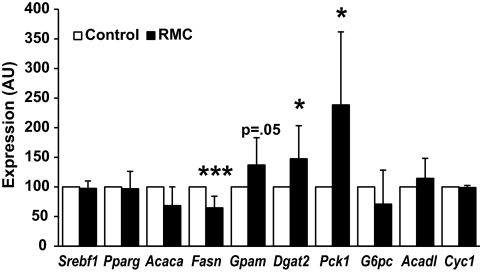
Research design and methods: We used fluorescence-activated cell sorting to measure hepatic leukocyte populations in genetic and diet forms of murine obesity. We characterized in vivo models that increase and decrease an obesity-regulated CCR2-expressing population of hepatic leukocytes. Finally, using an in vitro co-culture system, we measured the ability of these cells to modulate a hepatocyte program of lipid metabolism.
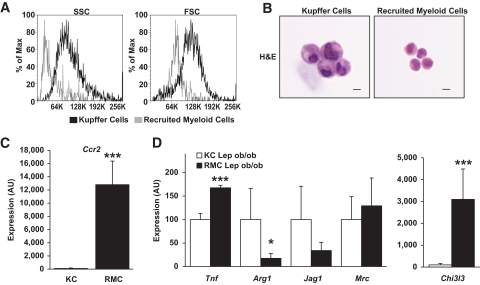
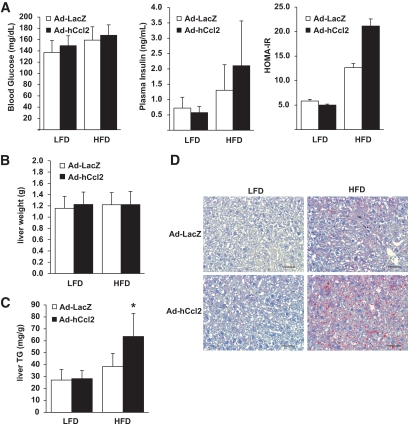
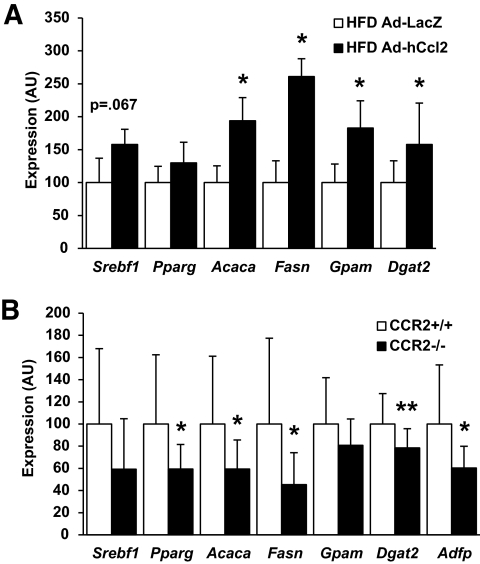
Results: We demonstrate that obesity activates hepatocyte expression of C-C chemokine ligand 2 (CCL2/MCP-1) leading to hepatic recruitment of CCR2(+) myeloid cells that promote hepatosteatosis. The quantity of these cells correlates with body mass and in obese mice represents the second largest immune cell population in the liver. Hepatic expression of CCL2 increases their recruitment and in the presence of dietary fat induces hepatosteatosis. These cells activate hepatic transcription of genes responsible for fatty acid esterification and steatosis.
Conclusions: Obesity induces hepatic recruitment of a myeloid cell population that promotes hepatocyte lipid storage. These findings demonstrate that recruitment of myeloid cells to metabolic tissues is a common feature of obesity, not limited to adipose tissue.
Figures
Similar articles
-
CC chemokine receptor 2 promotes recruitment of myeloid cells associated with insulin resistance in nonalcoholic fatty liver disease.Am J Physiol Gastrointest Liver Physiol. 2018 Apr 1;314(4):G483-G493. doi: 10.1152/ajpgi.00213.2017. Epub 2018 Feb 8. Am J Physiol Gastrointest Liver Physiol. 2018. PMID: 29420066 Free PMC article.
-
CCR2 modulates inflammatory and metabolic effects of high-fat feeding.J Clin Invest. 2006 Jan;116(1):115-24. doi: 10.1172/JCI24335. Epub 2005 Dec 8. J Clin Invest. 2006. PMID: 16341265 Free PMC article.
-
Hepatic recruitment of macrophages promotes nonalcoholic steatohepatitis through CCR2.Am J Physiol Gastrointest Liver Physiol. 2012 Jun 1;302(11):G1310-21. doi: 10.1152/ajpgi.00365.2011. Epub 2012 Mar 22. Am J Physiol Gastrointest Liver Physiol. 2012. PMID: 22442158 Free PMC article.
-
[Macrophages, inflammation, adipose tissue, obesity and insulin resistance].Gac Med Mex. 2007 Nov-Dec;143(6):505-12. Gac Med Mex. 2007. PMID: 18269082 Review. Spanish.
-
CCL2-CCR2 signaling axis in obesity and metabolic diseases.J Cell Physiol. 2024 Apr;239(4):e31192. doi: 10.1002/jcp.31192. Epub 2024 Jan 29. J Cell Physiol. 2024. PMID: 38284280 Review.
Cited by
-
Apoptotic vesicles restore liver macrophage homeostasis to counteract type 2 diabetes.J Extracell Vesicles. 2021 May;10(7):e12109. doi: 10.1002/jev2.12109. Epub 2021 May 24. J Extracell Vesicles. 2021. PMID: 34084287 Free PMC article.
-
The immunology of sickness metabolism.Cell Mol Immunol. 2024 Sep;21(9):1051-1065. doi: 10.1038/s41423-024-01192-4. Epub 2024 Aug 6. Cell Mol Immunol. 2024. PMID: 39107476 Free PMC article. Review.
-
Different Effects of Eicosapentaenoic and Docosahexaenoic Acids on Atherogenic High-Fat Diet-Induced Non-Alcoholic Fatty Liver Disease in Mice.PLoS One. 2016 Jun 22;11(6):e0157580. doi: 10.1371/journal.pone.0157580. eCollection 2016. PLoS One. 2016. PMID: 27333187 Free PMC article.
-
CCR5 plays a critical role in obesity-induced adipose tissue inflammation and insulin resistance by regulating both macrophage recruitment and M1/M2 status.Diabetes. 2012 Jul;61(7):1680-90. doi: 10.2337/db11-1506. Epub 2012 Apr 3. Diabetes. 2012. PMID: 22474027 Free PMC article.
-
Hepatocytes: A key role in liver inflammation.Front Immunol. 2023 Jan 18;13:1083780. doi: 10.3389/fimmu.2022.1083780. eCollection 2022. Front Immunol. 2023. PMID: 36741394 Free PMC article. Review.
References
-
- Postic C, Girard J: The role of the lipogenic pathway in the development of hepatic steatosis. Diabete Metab 2008; 34: 643– 648 - PubMed
-
- Shimomura I, Bashmakov Y, Horton JD: Increased levels of nuclear SREBP-1c associated with fatty livers in two mouse models of diabetes mellitus. J Biol Chem 1999; 274: 30028– 30032 - PubMed
-
- Zhang YL, Hernandez-Ono A, Siri P, Weisberg S, Conlon D, Graham MJ, Crooke RM, Huang LS, Ginsberg HN: Aberrant hepatic expression of PPARgamma2 stimulates hepatic lipogenesis in a mouse model of obesity, insulin resistance, dyslipidemia, and hepatic steatosis. J Biol Chem 2006; 281: 37603– 37615 - PubMed
Publication types
MeSH terms
Substances
Grants and funding
LinkOut - more resources
Full Text Sources
Molecular Biology Databases
Miscellaneous
