. 2010 Feb;9(2):510-20.
doi: 10.1158/1535-7163.MCT-09-0461. Epub 2010 Jan 26.

Interleukin-29 binds to melanoma cells inducing Jak-STAT signal transduction and apoptosis

Affiliations

Interleukin-29 binds to melanoma cells inducing Jak-STAT signal transduction and apoptosis

Kristan D Guenterberg et al. Mol Cancer Ther. 2010 Feb.

Abstract

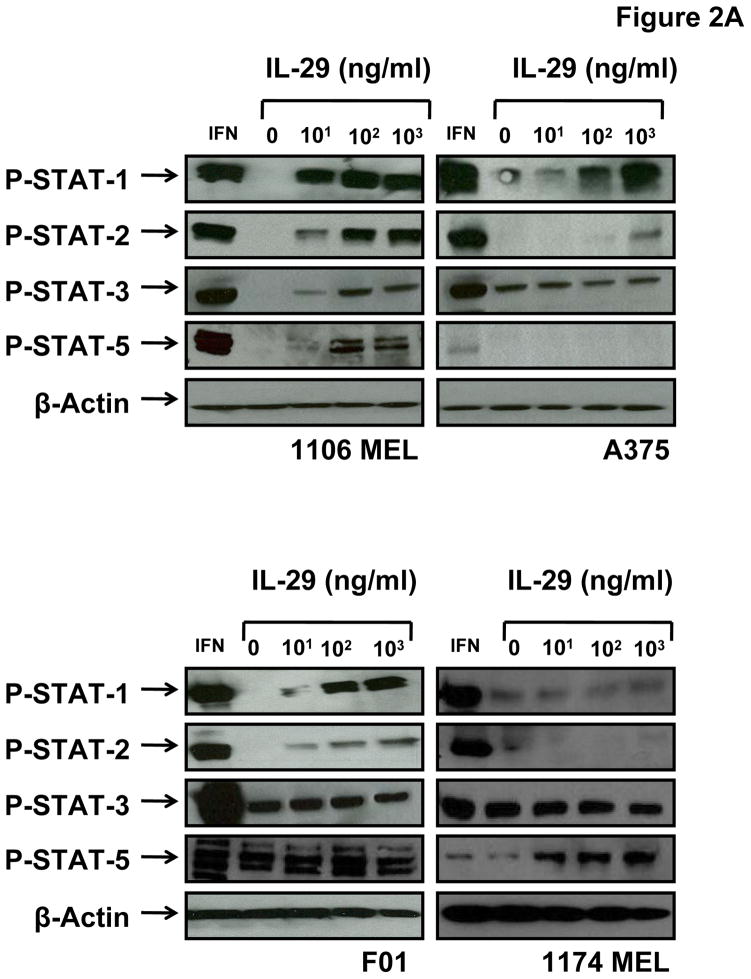
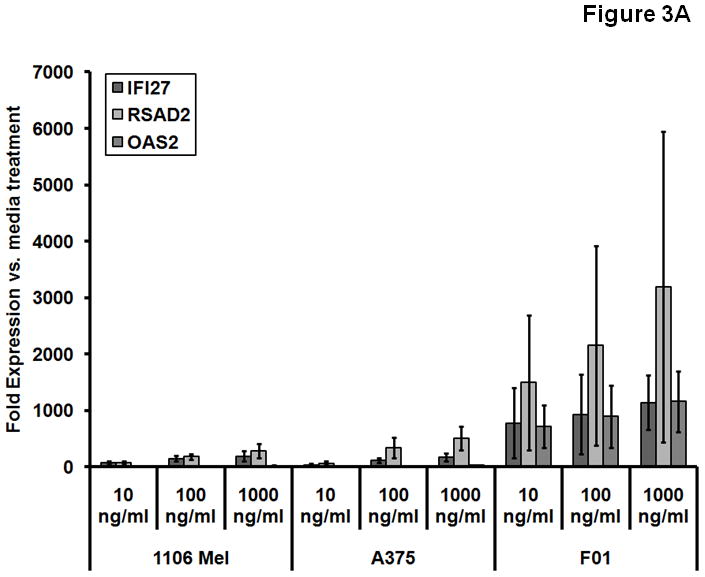
Interleukin-29 (IL-29) is a member of the type III IFN family that has been shown to have antiviral activity and to inhibit cell growth. Melanoma cell lines were tested for expression of the IL-29 receptor (IL-29R) and their response to IL-29. Expression of IL-28R1 and IL-10R2, components of IL-29R, was evaluated using reverse transcription-PCR. A combination of immunoblot analysis and flow cytometry was used to evaluate IL-29-induced signal transduction. U133 Plus 2.0 Arrays and real-time PCR were used to evaluate gene expression. Apoptosis was measured using Annexin V/propridium iodide staining. In situ PCR for IL-29R was done on paraffin-embedded melanoma tumors. Both IL-28R1 and IL-10R2 were expressed on the A375, 1106 MEL, Hs294T, 18105 MEL, MEL 39, SK MEL 5, and F01 cell lines. Incubation of melanoma cell lines with IL-29 (10-1,000 ng/mL) led to phosphorylation of signal transducer and activator of transcription 1 (STAT1) and STAT2. Microarray analysis and quantitative reverse transcription-PCR showed a marked increase in transcripts of IFN-regulated genes after treatment with IL-29. In the F01 cell line, bortezomib-induced and temozolomide-induced apoptosis was synergistically enhanced following the addition of IL-29. In situ PCR revealed that IL-10R2 and IL-28R1 were present in six of eight primary human melanoma tumors but not in benign nevi specimens. In conclusion, IL-29 receptors are expressed on the surface of human melanoma cell lines and patient samples, and treatment of these cell lines with IL-29 leads to signaling via the Jak-STAT pathway, the transcription of a unique set of genes, and apoptosis.


Figures

Fig. 1
Fig. 1
Melanoma cell lines express components of the IL-29 receptor. (A) mRNA expression of the IL-29 receptor (IL-10R2 and IL-28R1) was evaluated using RT-PCR. 18s was used as a housekeeping gene. (B) mRNA levels were measured by real-time PCR for the expression of the IL-10R2 and IL-28R1on the same cell lines and expression was calculated relative to 18s. The graph depicts a representative experiment of n=2. Columns; mean of triplicate wells, bars; SD.
Fig. 1
Fig. 1
Melanoma cell lines express components of the IL-29 receptor. (A) mRNA expression of the IL-29 receptor (IL-10R2 and IL-28R1) was evaluated using RT-PCR. 18s was used as a housekeeping gene. (B) mRNA levels were measured by real-time PCR for the expression of the IL-10R2 and IL-28R1on the same cell lines and expression was calculated relative to 18s. The graph depicts a representative experiment of n=2. Columns; mean of triplicate wells, bars; SD.
Fig. 2
Fig. 2
Melanoma cell lines signal via the Jak-STAT pathway. (A) The human melanoma cell lines 1106 MEL, A375, F01, and 1174 MEL cells were treated with IFN-α at 104 units/ml or IL-29 at 10, 100, or 1000 ng/ml and evaluated by immunoblot analysis for P-STAT1/2/3/5. Membranes were probed with β-actin antibody as a loading control. Human melanoma cell lines 1106 MEL, A375, F01, and 1174 MEL were stimulated with increasing doses of IL-29 (0–1000 ng/ml) for 30 minutes at 37°C and cells were evaluated for P-STAT1 by intracellular flow cytometry. Fluorescence data are presented as Fsp intensity of P-STAT1 staining (Fsp=FtFb). (B) Representative histograms for a single experiment and (C) graph for all cell lines evaluated. Columns; mean from a single experiment, bars; SD. (D) Protein levels of pAKT, pERK, and pSAPK were measured by immunoblot analysis after no treatment (0), or treatment with PMA (50 ng/mL), or IL-29 (10, 100, 1000 ng/mL).
Fig. 2
Fig. 2
Melanoma cell lines signal via the Jak-STAT pathway. (A) The human melanoma cell lines 1106 MEL, A375, F01, and 1174 MEL cells were treated with IFN-α at 104 units/ml or IL-29 at 10, 100, or 1000 ng/ml and evaluated by immunoblot analysis for P-STAT1/2/3/5. Membranes were probed with β-actin antibody as a loading control. Human melanoma cell lines 1106 MEL, A375, F01, and 1174 MEL were stimulated with increasing doses of IL-29 (0–1000 ng/ml) for 30 minutes at 37°C and cells were evaluated for P-STAT1 by intracellular flow cytometry. Fluorescence data are presented as Fsp intensity of P-STAT1 staining (Fsp=FtFb). (B) Representative histograms for a single experiment and (C) graph for all cell lines evaluated. Columns; mean from a single experiment, bars; SD. (D) Protein levels of pAKT, pERK, and pSAPK were measured by immunoblot analysis after no treatment (0), or treatment with PMA (50 ng/mL), or IL-29 (10, 100, 1000 ng/mL).
Fig. 3
Fig. 3
IL-29 induces transcription and protein expression of IFN-stimulated genes. Transcript levels of various genes were measured using real-time PCR analysis after the treatment of 1106 MEL, A375, and F01 human melanoma cell lines with IL-29 at 10–1000 ng/ml for 12 hours (A) or 1000 ng/ml for 12 hours (B). Columns; mean from three separate experiments, bars; SD.
Fig. 3
Fig. 3
IL-29 induces transcription and protein expression of IFN-stimulated genes. Transcript levels of various genes were measured using real-time PCR analysis after the treatment of 1106 MEL, A375, and F01 human melanoma cell lines with IL-29 at 10–1000 ng/ml for 12 hours (A) or 1000 ng/ml for 12 hours (B). Columns; mean from three separate experiments, bars; SD.
Fig. 4
Fig. 4
IL-29 treatment with and without chemotherapy increases apoptosis in the human melanoma cell line F01. (A) The pro-apoptotic effects of IL-29 were evaluated by Annexin V/PI staining in the human melanoma cell line F01 after a 48 hour treatment. Columns; mean from three separate experiments, bars; SEM. (B) F01 cells were cultured with IL-29 (10–1000 ng/ml) combined with bortezomib (10–20 nM) for 48 h. Cells treated with PBS served as a negative control in each assay. Apoptosis was measured using Annexin V/PI staining. Columns, mean of three separate experiments; bars, SEM. (C) Lysates from IL-29 and bortezomib stimulated F01 cells were evaluated for PARP cleavage expression via immunoblot analysis. β-actin served as a loading control. (D) Similarly, treatment with temozolomide (0–150 μM) and IL-29 (100–1000 ng/ml) at 48 h led to synergistic apoptosis as measured by Annexin V/PI staining. Columns; mean from three separate experiments, bars; SEM.
Fig. 4
Fig. 4
IL-29 treatment with and without chemotherapy increases apoptosis in the human melanoma cell line F01. (A) The pro-apoptotic effects of IL-29 were evaluated by Annexin V/PI staining in the human melanoma cell line F01 after a 48 hour treatment. Columns; mean from three separate experiments, bars; SEM. (B) F01 cells were cultured with IL-29 (10–1000 ng/ml) combined with bortezomib (10–20 nM) for 48 h. Cells treated with PBS served as a negative control in each assay. Apoptosis was measured using Annexin V/PI staining. Columns, mean of three separate experiments; bars, SEM. (C) Lysates from IL-29 and bortezomib stimulated F01 cells were evaluated for PARP cleavage expression via immunoblot analysis. β-actin served as a loading control. (D) Similarly, treatment with temozolomide (0–150 μM) and IL-29 (100–1000 ng/ml) at 48 h led to synergistic apoptosis as measured by Annexin V/PI staining. Columns; mean from three separate experiments, bars; SEM.
Fig. 5
Fig. 5
Melanoma cells show increased transcription of the IL-29 receptors. The cDNA of the mRNA of IL-10R2 and IL-28R1 were detected via in situ PCR amplification. Benign nevi were negative for IL-10R2 and IL-28R1. Cytoplasmic signal for IL-10R2 and IL-28R1 were present in melanoma lesions but not in benign nevi. Magnification, 40x, scale bars = 25 microns. Left column, receptor staining. Right column, negative control.

Similar articles

Cited by

References

    1. Belardelli F, Ferrantini M, Proietti E, Kirkwood JM. Interferon-alpha in tumor immunity and immunotherapy. Cytokine Growth Factor Rev. 2002;13:119–34. - PubMed
    1. Kim SH, Cohen B, Novick D, Rubinstein M. Mammalian type I interferon receptors consists of two subunits: IFNaR1 and IFNaR2. Gene. 1997;196:279–86. - PubMed
    1. Haque SJ, Williams BR. Signal transduction in the interferon system. Semin Oncol. 1998;25:14–22. - PubMed
    1. Darnell JE, Jr, Kerr IM, Stark GR. Jak-STAT pathways and transcriptional activation in response to IFNs and other extracellular signaling proteins. Science. 1994;264:1415–21. - PubMed
    1. Dumoutier L, Lejeune D, Hor S, Fickenscher H, Renauld JC. Cloning of a new type II cytokine receptor activating signal transducer and activator of transcription (STAT)1, STAT2 and STAT3. Biochem J. 2003;370:391–6. - PMC - PubMed

Publication types